The research project as a whole was quite enjoyable. I had trouble planning the initial stages of my sampling, but once I understood what I wanted to study the sampling came along fairly well. One hard part of this study was not having feedback on my small assignments over 40 days. This was during a time when I was doing my field experiments and formulating my data. When I received feedback, I became aware that I had made errors by including raw data on my graph, and ended up changing the results of my experiment to exclude slope aspect. After changing my data to a table that summarized my information. I was able to disprove my hypothesis. At first, I thought the results were underwhelming. However, when I began interpreting my results, I was fascinated with what I had found. Overall, the process was informative and I value the science of Ecology much more than when I started. I ended up learning how detrimental the invasive species Rubus Armeniacus can be to native vegetation, as it is capable of dominating interspecies competition within edge communities and disturbance zones on Vancouver Island. Most of all I like how ecological theory has changed my perception of the surrounding community, as I spent much time exploring its reaches, and learning about environmental processes at work.
Some ecological processes my hypothesis touches on are; relationship between garter snakes spatial distribution and ambient temperature; relationship between snakes that have similar niches; and how changing seasons affect garter snake populations.
Three key words for my research project are: thermoregulation, spatial ecology, boreal forest
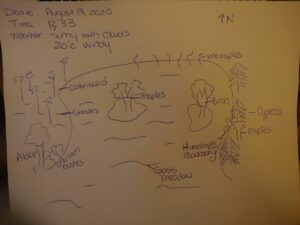
Weather condition: Sunny with clouds and slight breeze.
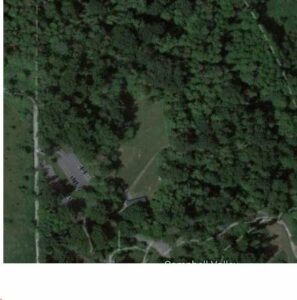
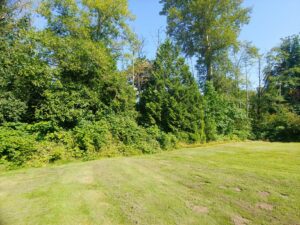
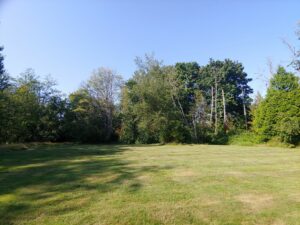
Location: Campbell Valley Regional Park, South Entrance, located in South Langley British Columbia. The location of Campbell Valley Park was clear cut in the early 20th century and the temperate rainforest has regrown. My study location is the Old Orchard area that is an open field surrounded by forest. There are many different tree species: Maples Acer psedoplantanus, Aspens Populus tremuloides, Cypress Cupressaceae, Birches Genus Betula to name a few. There are also vine maples Acer circinatum, invasive Himalayan Blackberry.
Questions:
What is the abundance of tree species around the field.
What is the abundance of plant species in the north section of the forest.
Why is there a pure stand of Aspens on the west side of the field vs a mixed stand north and east?
I chose three days that all varied in temperature to observe how the ambient temperature affected the snakes behaviour. My sample unit was a 72x56in plot that had an area of 2.6m^2, I used this sample unit in three separate locations: the wood pile, the garden, and the stone steps. The data I recorded was the ambient temperature and the number of snakes present or absent. I repeated this on three different days and in total I had nine replicates.
The following is the data I collected
Day 1: 6/20/20, 24*C, sunny with few clouds, 11:20
Day 2: 6/29/20, 34*C, sunny, heat warning in effect, humid, 13:53
Day 3: 7/10/20, 14*C, approx. 1 hour post thunderstorm, overcast, 09:10
Day 1 (24*C)
Day 2 (34*C)
Day 3 (14*C)
Wood Pile
2
1
4
Garden
1
0
0
Stone steps
0
3
0
Overall the patterns I’ve observed support my hypothesis.
My hypothesis is that flooding has an effect of the variety of plant life growing alongside a creek. Ecological processes that my research project may touch on are the impact of flooding on plant life, adaptations that allow some plants to survive flooding, and competition for resources along a creek/river side gradient. Other ideas my project may relate to are soil moisture and sun exposure. I could also look at the effects of melting snow in the spring and excess rain on plants living near moving water.
Three key words that I could use to describe my research project are flooding, creekside vegetation, and competition.
Given the results of my initial data collection and the advice I recieved on my sampling design, I have decided to change a few things about my project.
My hypothesis is that flooding effects the composition of plant species along the creek. I predicted that the plant species composition would increase as distance from the creek increased due to the plants furthest from the creek not having to endure the harsh spring flooding.
I have fifteen transects, each 10m from the last, along the creek. Within each transect, I placed my 1m2 quadrat four times:
Q1- Within two meters from the walking trail.
Q2- Two meters into the bush.
Q3- Four meters from the trail and four meters from the creek.
Q4- Within two meters from the creek.
I completed my data collection today. My sampling design was easy to implement for the most part. However, some areas near the creek were quite steep with thick bush. It was difficult to be accurate with my measurements when collecting some of the Q3 and Q4 samples, but I tried to keep it as accurate as possible.
My data seems to support my prediction for the most part. Q4 only had 5 different plant species in total and Q3 had 9. However, Q2 and Q1 both supported 13 different species, suggesting that four meters from the creek is when plant composition begins to drop off.
The paper I chose to look over was Herbivore grazing—or trampling? Trampling effects by a large ungulate in cold high-latitude ecosystems
This article is safe to say that it is academic because it is written by several experts in the respective field and it is based from original research from Department of Environmental and Health Sciences at the University College of Southeast Norway. There are also in text citations are present, followed by a References section that are of credible sources.
This research paper is also peer reviewed based on where it is published. It is from the Wiley Online Library where there are the requirements to meet their manuscript submissions. Including going through the processes of being peer reviewed and going through the editor. Additionally it has an accepted date of Accepted: 26 April 2017 after the received date that was January 27, 2017. So it is clear that it made it through all of those hurdles.
The article can be considered research material because it includes the requirement of materials and methods. And it also has specific experiment and analysis geared directly to this specific study.
Heggenes, J, Odland, A, Chevalier, T, et al. Herbivore grazing—or trampling? Trampling effects by a large ungulate in cold high‐latitude ecosystems. Ecol Evol. 2017; 7: 6423– 6431. https://doi.org/10.1002/ece3.3130
The area I have chosen is on private land in a rural farm community outside of Taylor, British Columbia. It is approximately 12 acres in total with a predominately coniferous forest with a ravine that holds a small creek and both sides of the creek are farmed fields. The ravine itself boasts a lot of value with many different features such as small wetlands due to beaver (Castor canadensis) activity, pooling water and the running creek itself. It is important to note the creek is a lot more bank full than normal due to the increased amount of precipitation.
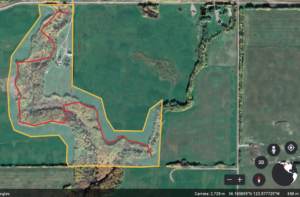
Figure 1. Area in yellow is the perimeter of the observation site. Red line that was walked within the area.
I first visited this area on July 14th, 2020 at 1400 hrs until approximately 1600 hrs. The weather was 20 degrees celsius with some overcast but, it was incredibly muggy. I remained in the area that is highlighted in yellow and scouted around within that perimeter that can be represented in the red line. The size of the chosen observation area is approximately 0.31 square kilometres.
The vegetation from the bottom of the ravine consisted of typical wetter vegetation species such as:
Lady fern (Athyrium filix-femina)
Meadow Horsetail (Equisetum pratense)
And then carrying up the slope gradient the vegetation has noticeable changes leading into species such as
Prickly Wild Rose (Rose acicularis)
Cows Parsnip (Heracleum maculatum)
A few willow species (Salix spp)
Saskatoon (Amelanchier alnofolia)
Soopolallie (Shepherdia canadensis)
Leaving the ravine and going into the field there are a good mix such as
Foxtail Barley (Hordeum jubatum)
Timothy (Phleum prantense)
Kentucky Bluegrass (Poa prantensis)
Northern Brome (Bromus inermis)
Alsike Clover (Trifolium hybridum)
Alfalfa (Medicago sativa)
This crop farmed field is mostly Alfalfa with the other species making random appearances throughout the field. It would be good to do a proper walk though out the field as well.
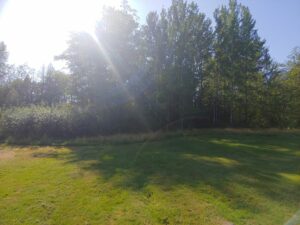
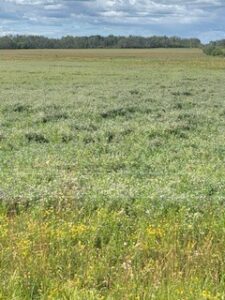
Figure 2. View of the field that is hayed yearly.
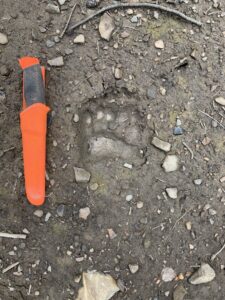
There was also noted to be Black bear activity (Ursus americanus) due to several ant hills being dug up and some old marking in trees as well as tracks.
Figure 3. Black bear tracks located on the south side of the ravine.
There is also a lot of ungulate activity in terms of tracks and droppings. Mostly White tailed deer (Odocoileus virginianus) and Moose (Alces alces). Elk (Cervus canadensis) are also known to frequent the area but, determining the difference in tracks is a little tricky.
Potential subjects and relevant questions
Question 1: Do the species of ungulates that frequent the upper field selectively graze? (I feel this is where I will go with my study)
Question 2: Despite being older and potentially no longer in use, how much is the old beaver dam impacting the area of the lower ravine?
Question 3: Is this relatively small area able to support a Black bear for a suitable territory or is it a series of areas frequented?
My initial data collection day went as planned and I was able to implement my sampling strategy with relative ease, despite plots landing in black hawthorn bushes and one plot that was inches away from a large hornets nest! I brought along an assistant (my wife) to help with note taking and tape measure holding which aided in the process.
The soil texture results were as I thought they would be with courses texture results on the steep slope section, with the exception of one plot out of a total of 20. Given my successful experience implementing my initial data collection I intend to continue subsequent data collection in the same way.
A possible modification I may make is the spacing of my plots and transect lines. Currently transect lines are spaced 10m apart with plots every 15m on each transect line. I insured that I evenly captured both the gentle and steep slope sections, however, I wonder if I should attempt to cover a larger total area. I could do this either by allocated more distance between transect lines and/or between plots.
I conducted an area-based haphazard sampling experiment. I was sampling species diversity and vegetation cover in the garden. I didn’t have trouble with implementing my sampling strategy and i feel that I chose the most efficient strategy for the area I studied. I was surprised to see the abundance of fowler’s toads (Anaxyrus fowleri), this is most likely due to breeding season being late March- early June with the tadpole stage taking 50-65 days (Ontario Nature) meaning that there are many young toads living on land now. This could also be a factor to why there is an abundance of garter snakes (Thamnophis sirtalis) in the area since they are predators of toads. Another factor explaining the high toad density in the garden is the high vegetation cover, this supplies toads with an environment with suitable protection from predators, such as birds or rodents, and also lots of food, such as insects. I think that I will adjust my strategy by sampling a larger area so I can get a more in depth understanding of species diversity in the area rather than vegetation cover.