Recent Posts

Blog Post 5: Design Reflections

User:  | Open Learning Faculty Member: 


For the collection of my initial data, I used stratified random sampling to sample the number of Western sword ferns in the marsh area, upland transition areas and the upland area. My hypothesis is that Western sword ferns prefer the upland area compared to the marsh and upland transition as a result of drier soil.  The difficulties I encountered were that I didn’t realize how dense some of the areas of the forest were, with lots of bushes and shrubs. I had to really bushwhack and force my way to some of the locations which were very challenging.  The data I did collect was in line with my hypothesis so it was not that surprising. Although my sampling technique was very challenging I plan to keep using this technique since I feel it will yield more precise results although I do plan to increase the size of my sampling unit as a felt 1meter squared was too small for this study.

Blog Post 2: Sources of Scientific Information

User:  | Open Learning Faculty Member: 


For this post, I have selected an ecological article titled “Warming and shifting phenology accelerate an invasive plant life cycle”. I found this article online in the journal Ecology, accessed through the UNBC library and available through Open Access. The link is:  https://doi-org.prxy.lib.unbc.ca/10.1002/ecy.3219.

This article is classified as academic, peer-reviewed research material. The source shows that both authors Keller and Shea are affiliated with Pennsylvania State University, multiple in-text citations are used, and a bibliography is available at the end of the document. Therefore, it is an academic article. In the acknowledgements section of the article, three people are thanked for their feedback on the article. Therefore, I conclude that it was peer-reviewed. Finally, there is a methods section which describes a field study in the article. So, I can conclude that it is a research article. The article is linked as documentation supporting my classification.

Blog Post 1: Observations

User:  | Open Learning Faculty Member: 


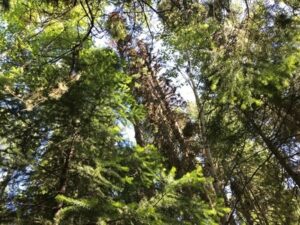
The location that I have selected for study is a forested section of land immediately next to my house. It is a section of Crown land located between the highway and a side road in the Cariboo region.

It is approximately 0.2ha of rolling topography which has depressional areas. I have visited this site recently during the months of May and June, under varying weather conditions of rain and sunshine during the spring months. Today it is about 20 degrees with sunshine.

There are many subjects for potential study using this location. I have the following questions which could form the subject of a research study:

  1. How does canopy closure or lack of canopy closure influence species biodiversity in the area?
  2. Is this area being used by large mammals? If not, are there ways to encourage its use?
  3. Are there invasive plants at the site? How are they affecting the biodiversity and health of the site?
  4. How does the biodiversity differ between a site which is located close to our well and one located farther away?

Images:

Overview of the Forested Lot

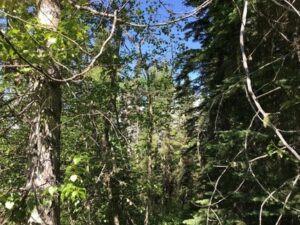
Dead Standing Timber in Lot

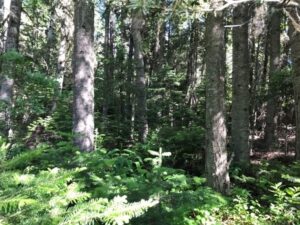
Interior of the Forested Lot showing Canopy Gaps

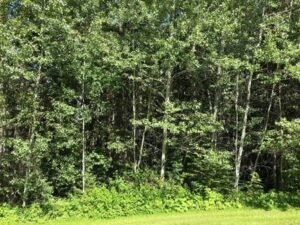
Characteristic Understorey Vegetation


Post 9: Field Research Reflections

User:  | Open Learning Faculty Member: 


This course and its field research project were novel, difficult, eye-opening, and mind-expanding. Having never taken an online university course before, the experience was new to me. Having been out of school (college) for >10years and launching into a 3rd year science course, I found the workload and expectations difficult – attributes I am grateful for, because it makes me feel that I have earned the credits. The course and project were eye-opening, because I got to see the sheer amount of work that scientists put into the field-components of their research. And the concepts – especially those of predictor and response variables and how they tie into the experimental/statistical designs – blew my mind.

In terms of the field-research component of this course, I’d like to expand on the eye-opening comment I just made. First of all I spent countless hours looking for patterns in the winter ecosystems around my home and the forests that I work in. Each pattern I found was not suitable for experimental analysis. I had to start over at one point when the instructor pointed out to me that my initial plan (assessing aspen ramet attributes [density, height, girth] as a response to distance from an abandoned beaver lodge) was fraught with sampling vs replication errors and bias, to which I am grateful for the reality check. During this time I read about experimental design for sampling vegetation, and I used this information to design the experiment I finally landed on, which seemed to work for me (though I likely would have chosen a different setup had I taken the time to read the literature at this point in the course).

I spent days creating quadrats out of wood as well as tent-like wooden structures to carry out my experiment of testing springtail snow-surface density (response variable) to covered and uncovered environments (predictor variable). Then I spent 5 days counting springtails at three specific times each day. The data set that I generated was time-consuming to analyze and I felt lost in the world of excel and the utter mystery of statistics, and the results were a tiny bar graph! Comparing this to the amount of data-gathering and intricate designs outlined in some of the papers we had to read for this course, I see how scientific research can be so all-consuming and difficult to perform. Hats off to scientists!

By the time my data was collected and my literature review began, I started to realize that my project could/should have been so much more. I should have done more replicates. I should have sampled in different habitats such as forests, wetlands, and wildfire-burnt openings. I should have measured temperature above the surface instead of on the surface. I should have identified each and every springtail individual to the species level. I should have factored in other weather-related variables as predictors such as cloud cover and barometric pressure. The list could go on.

All in all, the reality of studying ecology – its wonders, difficulties and intricacies – very much hit home thanks in large part to this field research project.

Blog Post 4: Sampling Strategies

User:  | Open Learning Faculty Member: 


  1. Which technique had the fastest estimated sampling time?

Systematic sampling was the fastest since the sampling quadrants were relatively close to each other.

  1. Compare the percentage error of the different strategies for the two most common and two rarest species.

Systematic Sampling:

Two most common:

  • Eastern Hemlock density was 469.9 stems/ha whereas the calculated density was 484.0 stems/ha.

The percent error = (484.0 – 469.9)/ 469.9* 100 = 3%

  • Sweet Birch density was 117.5stems/ha whereas the calculated density was 108.0stems/ha.

The percent error = (108.0 – 117.5)/ 117.5* 100 = 8.1%


Two rarest species:

  • Striped Maple density was 17.5 stems/ha whereas the calculated density was 16.0 stems/ha.

The percent error = (16.0 – 17.5)/ 17.5* 100 = 8.6%

  • White Pine density was 8.4 stems/ha whereas the calculated density was 0.0 stems/ha.

The percent error = (0.0 – 8.4)/ 8.4   * 100 = 100%

 Total time to sample: 12 hours, 37 minutes

Random Sampling:

Two most common:

  • Eastern Hemlock density was 469.9stems/ha whereas the calculated density was 575.0 stems/ha.

The percent error = (575.0 – 469.9)/ 469.9* 100 = 22.4%

  • Sweet Birch density was 117.5stems/ha whereas the calculated density was 129.2 stems/ha.

The percent error = (129.2 – 117.5)/ 117.5* 100 = 9.96%


Two rarest species:

  • Striped Maple density was 17.5 stems/ha whereas the calculated density was 25.0 stems/ha.

The percent error = (25.0 – 17.5)/ 17.5* 100 = 42.9%

  • White Pine density was 8.4 stems/ha whereas the calculated density was 4.2 stems/ha.

The percent error = (4.2 – 8.4)/ 8.4   * 100 = 50%

Total time to sample: 12 hours, 49 minutes


Haphazard Sampling:

Two most common:

  • Eastern Hemlock density was 469.9stems/ha whereas the calculated density was 548.0 stems/ha.

The percent error = (548.0 – 469.9)/ 469.9* 100 = 16.6%

  • Sweet Birch density was 117.5stems/ha whereas the calculated density was 120 stems/ha.

The percent error = (120.0- 117.5)/ 117.5* 100 = 2.1%


Two rarest species: 

  • Striped Maple density was 17.5 stems/ha whereas the calculated density was 4.0 stems/ha.

The percent error = (4.0 – 17.5)/ 17.5* 100 = 77.1%

  • White Pine density was 8.4 stems/ha whereas the calculated density was 16 stems/ha.

The percent error = (16.0 – 8.4)/ 8.4   * 100 = 90.5%

Total time to sample: 12 hours, 55 minutes


  1. Did the accuracy change with species abundance?

The accuracy was lower for the rarest species when compared to the species that were more abundant.

  1. Was one sampling strategy more accurate than another?

Systematic Sampling was the more accurate method and Haphazard Sampling was the least accurate.
Post 9: Field Research Reflections

User:  | Open Learning Faculty Member: 


Overall, my study went quite well, but of course not perfect. I ended up having quite different results than I had expected and found it difficult to find journal articles that supported my study. I do wish I had spread out my course load and did not have to rush my project at the end, as I think I could have done a better job. I did have to adjust my hypothesis while planning my study design but not at any point afterwards.

I really enjoyed this course. It did feel like a lot of work at times but I really appreciated having such a hands-on online course. It is often difficult to stay engaged during online courses, but the field research project made it a lot easier. I have a great appreciation for all of the work that ecologists do.

Post 6: Data Collection

User:  | Open Learning Faculty Member: 


Last week I went out to collect the data for my field project. Low tide was particularly low – between 0 and 0.5m – and I had three days without rain. On Tuesday I did site a, on Wednesday site b, and on Friday I did sites c and d. At each site I did 10 replicates. It took me 10-20 minutes to generate, diagram & plan movement between the 10 co-ordinates, and sampling took between 19-58 minutes at each site (varying depending on how many oysters I was finding: site d only took 19 minutes, but 6 of the 10 samples had no oysters).

The sampling design worked fairly well. Once I placed the 1m x 1m markers, I looked for oysters, and for each oyster I added a tally mark to the “T” (for total) column, and then tallies for its position relative to the rocks. After collecting data at site b, I made the table where I recorded the tallies larger, because a couple of samples at site b had so many oysters that the tally marks didn’t fit entirely in one box. I also made a note to clarify that the “N” column, for oysters not in any rock shadow, includes oysters that are on top of or attached to the front of rocks. Oysters that are on top of a rock, but in the shadow of some part of the rock, are not included in the N column but in the relevant L, R, or B columns.

I think I may have to exclude sample 8 at site c, because that sample had 2 large rocks that were absolutely covered in oysters, to the point that that sample had 50 more oysters than any other sample. Because the rocks were covered, many oysters were behind other oysters, not behind any rocks. I recorded the ones behind other oysters in the “B” column because they are in the shadow of something breaking the wave action, but in hindsight I have no way of knowing which oysters came first, so some of the ones that are currently behind oysters may have not been earlier in their growth. For these reasons I think sample 8 can be disregarded.

Interestingly, an ancillary pattern seems to be that the difference between B and N is not large, but there are many fewer oysters found left or right than are found behind or not in shadow. I wonder if there might be something advantageous to the oysters to being towards wave action that only kicks in if the oyster is fully exposed – this might explain why there are many oysters behind rocks and not at all protected by rocks, but not slightly protected on either side. Or maybe there’s some aspect of fluid dynamics that means the water movement at the sides of rocks is worse than not near rocks.


Blog Post 4: Sampling Strategies (Robyn Reudink)

User:  | Open Learning Faculty Member: 


Systematic sampling was slightly faster than the other sampling techniques – taking a total of 12 hours & 4 minutes. Whereas both the random and haphazard sampling techniques took a total of 2 hours & 41 minutes.  This is likely because the quadrats in the systematic sampling technique are laid out in a linear transect, which potentially reduces the amount of time that is spent walking between quadrats.

The percent error of the different strategies for the 2 most common species, Eastern Hemlock & Sweet Birch and the 2 least common species, Striped Maple & White Pine, are outlined in the attached table. The random sampling technique was the most accurate of the strategies, as it had the lowest percent error for all species. For all of the sampling strategies, the accuracy was on average higher for species that were more common in the study area, than less abundant species.

Table – blog post 4

Blog Post 3: Ongoing Field Observations (Robyn Reudink)

User:  | Open Learning Faculty Member: 


  1. Identify the organism or biological attribute that you plan to study.

The organism that I choose to study is the growth rates of Sunflower plants (sp. Helianthus annuus).

  1. Use your field journal to document observations of your organism or biological attribute along an environmental gradient. Choose at least three locations along the gradient and observe and record any changes in the distribution, abundance, or character of your object of study.

The potted sunflower plants are located on a concrete slab in an area that is approximately 20 m2. There are a total of 8 individual plant pots setup for this experiment – located adjacent to each other – with ~0.5m of space left between individual pots and setback ~2m from any adjacent vegetation and/ or structures. Note: there are 3 sunflower plants being grown in each of the 8 pots – for a total of 24 individual sunflower plants in this study – there are 12 sunflower plants in each of the 2 study groups (a low-water volume application group & a high-water volume application study group).

Refer to the attached diagram for an overview of the study area design which shows: the plant pot setup with sunflower plants nomenclature, and adjacent vegetation/ structure. Plants replicates L1 through L12 are all in the low-water volume group and plant replicates H1-H12 are all in the high-water volume group.

There have been no visual changes observed, to date, in the distribution, character or abundance of the potted sunflower plants. This is likely because the sunflower plants seeds were recently planted on May 26th and have not yet sprouted. However, there are slight differences between the plant pot locations within the study area, including – the physical location of each pot, and the vegetation and/ or structure that is located adjacent to each pot on the perimeter of the study area. My observations at the different locations within the study area, include:

  • Sunflowers plants L1-L3, & H1-H3 are all located in the SE section/ quadrat of the study area. These plants are located immediately adjacent to ornamental cedar bushes and an ornamental grass lawn on the south and east perimeters of the study area.
  • Sunflowers L4-L6, & H4-H6 are located in the SW study area quadrat of the study area. These plants are located immediately adjacent to ornamental pine and cedar bushes on the south and west perimeters of the study area.
  • Sunflower plants L7-L9, & H7-H9 are located in the NE study area. These plants are located immediately adjacent to an ornamental grass lawn and a house on the east and north perimeters of the study area.
  • Sunflowers L10-L12 & H10-12 are located in the NW study area quadrat. These plants are located immediately adjacent to a house and cedar bushes on the north and west perimeters of the study area.
  1. Think about underlying processes that may cause any patterns that you have observed. Postulate one hypothesis and make one formal prediction based on that hypothesis. Your hypothesis may include the environmental gradient; however, if you come up with a hypothesis that you want to pursue within one part of the gradient or one site, that is acceptable as well.

The underlining process that may cause patterns for this study is the 2 different water volume applications (low & high), these are the studies predictor variables. My hypothesis is that any observed changes in the size of the above ground portion of the sunflower plants are likely due to the water level applications. This is considered to be a manipulative experiment – as there are 2 predictor variables – while the other factors that could potentially influence the response variable are controlled therefore, this will allow me to reject or accept my hypothesis with a high degree of certainty. My prediction is that the size and density of the above ground portion of the sunflower plants will be significantly larger in the high-water volume study group, when compared to the low-water volume study group.

  1. Based on your hypothesis and prediction, list one potential response variable and one potential explanatory variable and whether they would be categorical or continuous. Use the experimental design tutorial to help you with this.

The potential response variable for this study are the size of the above ground portion of the sunflower plants (continuous). The potential explanatory variable are the amount of water received (low or high group) by each plant (categorical) in the study.

blog post 3- diagram


Blog post 2: Sources of scientific information

User:  | Open Learning Faculty Member: 


The ecological resource that I selected is an eBook from the TRU library, titled: “Experiments in Ecology: Their Logical Design and Interpretation Using Analysis of Variance” by A. J. Underwood (1997). This is considered to be academic peer-reviewed material source, as the author is considered to be an expert in this field and the book has been peer reviewed. Further, many sources of supporting academic peer-reviewed references are used throughout this book.

Hyperlink:

https:// ezproxy.tru.ca/eds/ebookviewer/ebook/bmxlYmtfXzU3MDM4Ml9fQU41?sid=4bd84846-9fb3-434f-a331-4bc1304e4be2@sessionmgr101&vid=1&format=EB&rid=1