Recent Posts

Post 4: Sampling Strategies

User:  | Open Learning Faculty Member: 


The 3 sampling methods I used were area based random or systematic (1) , area based haphazard (2) and distance based haphazard (3). The forest I sampled was the Snyder-Middlesworth Natural Area.

The distance haphazard method was the fastest sampling time at 57 minutes, while both area based sampling methods took 2 hours and 36 minutes.

Percentage errors for 2 rarest species:

Chestnut Oak

  1. 37.4%
  2. 54.6%
  3. 100%

Striped Pine

  1. 357.7%
  2. 100%
  3. 100%

Percentage errors for 2 most common species:

Eastern Hemlock

  1. 36.2%
  2. 31.9%
  3. 52.2%

Sweet Birch

  1. 36.1%
  2. 36.1%
  3. 122.8%

The most accurate sampling method for the 2 rarest species was the haphazard method and the most accurate for the 2 most common species was the random or systematic method.

Overall I found the most accurate sampling method was the haphazard method (area or distance based).

Blog Post #4: Sampling strategies

User:  | Open Learning Faculty Member: 


The three sampling strategies I used in the virtual forest tutorial are Systematic, Random and Haphazard techniques.

I used area based methods to compare among the sample placement strategies. Please find here below, the tables demonstrating the collected sampling data collected on Snyder-Middleswarth Natural Area Community.
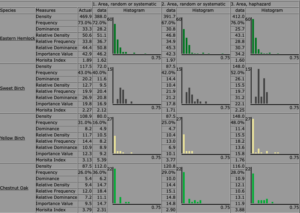
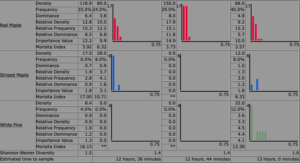
Among the three techniques, the Systematic sampling had the fastest estimated sampling time of 12 hours and 36 minutes; whereas Random sampling estimated time was 12 hours, 44 minutes; and 13 hours for the Haphazard sampling method.

Among the two most common species: Eastern Hemlock and Sweet Birch, Haphazard sampling technique was relatively the most accurate giving the lowest percent error of 12.3% for Eastern Hemlock and 25.9% for Sweet Birch.

Random sampling technique gave the lowest percent error for Sweet Birch, 25.5%, which is very close to Haphazard sampling technique; and the second lowest percent error of 16.6% for the Eastern Hemlock species.

In all the three techniques, Systematic sampling seem to be the least accurate due to the highest percent errors in the most common species, 17.4% for Eastern Hemlock, and 28.7% for the Sweet Birch.

The two rarest species appeared to be the Stripped Maple and White Pine. In both Systematic and Random sampling technique the percent error values for the White Pine species is 100% because none of the White Pines were present in the selected samples. Similarly, the percent error is 100% in Stripped Mapple species using the Random sampling technique. However, the percentage error was the lowest, 31.4% in Stripped Maple species using the Haphazard technique; and 60% percent error using the Systemic sampling method. Lastly, the highest percentage error observed was 280% of the White Pine using the Haphazard sampling method.

According to the data above, the overall accuracy is higher in the most common species, and lower in the rarest species in all sampling techniques. So the more abundant the species, the higher the accuracy.

Overall the Haphazard sampling technique was relatively the most accurate of the three techniques.


Blog Post 3: Ongoing Field Observations

User:  | Open Learning Faculty Member: 


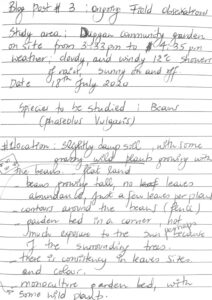
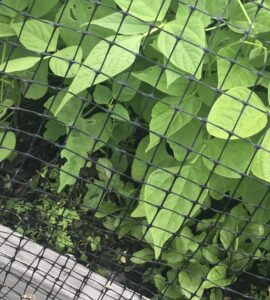
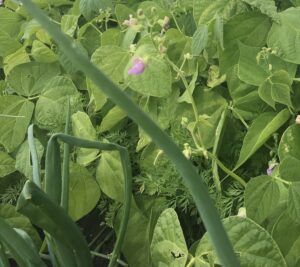
Below are the scanned images from my field journal showing the ongoing Field Observations at Duggan Community Garden. This time I decided to narrow my observations to one plant species-the beans (Phaseolus vulgaris)-in the garden.

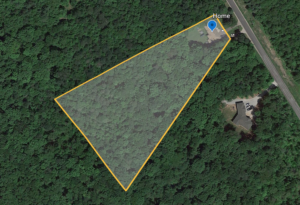
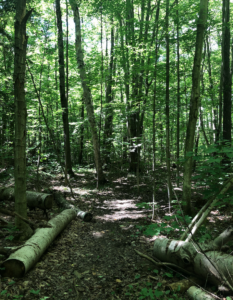
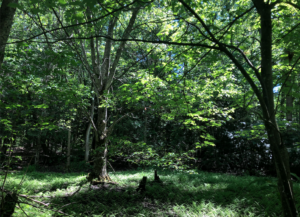
Below are the images of the three locations where I did my observations. Location 1, 2, and 3 respectively.
Processes that may have caused the observed patterns. 

  1. More exposure to the sun may have caused more abundance of the bean plants, especially the larger leaves, and the abundance of flowers.
  2. The presence of other plant species, other than the beans may have induced more growth.

Hypothesis

The growth of bean plants is stimulated by the presence of other plant species in a polyculture environment.

Prediction

The beans in the first location (first garden bed-monoculture) will grow less abundantly (fewer leaves; and fewer flowers per plant) than the beans in the second location (Fifth garden bed from the first one-polyculture).

Variables

Predictor variables: presence or absence of other plant species (in this case carrots, pumpkins, peas and onions) in the same location (one feet) from the bean plants.

Response variable: bean plant abundance (total number of leaves, and flowers per plant)

The response variable is continuous, while the predictor variables is categorical (two level factor).


Blog Post 5: Design Reflections

User:  | Open Learning Faculty Member: 


I used systematic sampling across each of my three cross-sections to study soil moisture, using a 7inch probe, along the slope of my chosen area. At each interval I’d measure one soil moisture reading, the percent slope using a level and ruler, and the presence/absence of trees in a 2m2 radius.

There were a number of key issues I ran into throughout this process. The process of systematically sampling horizontally across the slope and taking only one reading at each stop did not always render replicates with similar slopes for comparison. In order to address this issue moving forward, I may have to modify my design to include taking more than one percent slope and soil moisture reading within each quadrant to ensure replicates and/or set pre-determined ranges for what constitutes a mild, moderate and severe percent slope for clarity purposes. The second issue I ran into was using my equipment in a consistent manner. Initially I would insert the soil moisture probe to its maximum depth, but ran into issues in later sampling when this was not possible due to soil conditions. To ensure the accuracy of my results in future sampling, I need to improve the consistency from which depth I take my soil moisture readings. I can accomplish this by either taking moisture readings at various depths at each point or marking an insertion limit on the probe itself at some point <7inches to ensure that it’ll be consistently inserted to the same depth. Other general modifications to future sampling will include expanding the size of my quadrants to improve data collection regarding tree sampling, and to gather more detailed information regarding the observed trees in order to better understand the potential impact of soil moisture, as it pertains to slope, on their growth. I will continue to implement systematic sampling; however, it will obviously need to be adapted to account for the larger quadrant sizes. I will also look into whether there is a way to accurately, and more efficiently measure percent slope since using a level and ruler was a tedious, and time-consuming process that will only become more challenging with more sample points.

The results were surprising to me in that they were not aligned with my prediction. I predicted soil moisture would be highest at the bottom of the slope, and what I found during this preliminary research was that it was highest at the midpoint. I have some ideas about why this might be, but evidently, I will have to wait until I’ve collected more data to comment on the findings with any reliability.

Blog Post #4

User:  | Open Learning Faculty Member: 


In the virtual forest tutorial, I chose Mohn Mill as my community sample. I chose to do area-based sampling using haphazard, random, and systematic methods. The haphazard method of sampling had the fastest estimated sampling time at 14 hours and 48 minutes, followed by the systematic method (16 hours and 59 minutes), and the random method (18 hours and 13 minutes).

Percentage errors of the two most abundant species:

Red Maple:

  • Haphazard- 2.68%
  • Random- 8.20%
  • Systematic-11.5%

Chestnut Oak:

  • Haphazard-2.90%
  • Random-2.05%
  • Systematic-5.08%

Percentage errors of the two least abundant species:

White Pine:

  • Haphazard- 100%
  • Random- 54.4%
  • Systematic-53.9%

Downy Juneberry:

  • Haphazard-44.0%
  • Random- 53.9%
  • Systematic- 57.0%

It is clear from the data that the more abundant species were more accurate than the less abundant ones. Overall, the random method was most accurate, followed by systematic, and then haphazard. Although haphazard sampling is more time efficient, it is not as accurate as the other two methods. It surprised me to see that haphazard sampling was the most effective for common species and that random/systematic sampling was most effective for uncommon species. I would expect haphazard sampling to be more effective for less common species, as samples are chosen subjectively. I would expect systematic sampling to be most effective for common species. My surprising results are likely due to my not taking enough samples before collecting and analyzing the data or poor choices when choosing quadrants to sample.

Blog Post 9 – Field Research Reflections

User:  | Open Learning Faculty Member: 


Throughout this course, I have come to appreciate the work that gets put into ecological research, and all the pieces that need to be put together in order to create just one study. It has been good practice to turn simple observations into a full project, and when I initially started I wasn’t quite sure how it was all going to work out in the end. Reading through all the research papers in this course helped alot, and I felt as though I was really able to grasp how a paper should come together. It has been interesting linking together all the natural processes that are occurring in the field and has been rewarding seeing all my work come together onto one report. Building and designing a study has been much more work than I expected. Not only this, but the time it actually takes in the field to build transects, quadrants, count specimens, and more, is much greater than anticipated. I can only imagine the time and effort large scale studies would take, and this helps me understand why research can take years and years to complete. Over this course I often changed my design slightly, up until the final report. There is so much to learn, and each module I learned new pieces of key information that helped build my final report. Looking forward to using all this new-found knowledge for future learning and research!

Blog Post 8 – Tables and Graphs

User:  | Open Learning Faculty Member: 


My graph was fairly straight forward and compared the number of red alder present in my study area compared to the soil moisture reading of all quadrants. Soil moisture readings ranged from 0 to 6, with 0 being the least amount of moisture. The trend on my graph shows that as the number of red alder increases, the soil moisture reading increases as well. This graph supports my hypothesis that red alder require higher soil moisture, and is exactly what I had expected.

I did not have any difficulties organizing, aggregating or summarizing my data while creating this graph. After my graph was marked, I realized that I should have put my sample size in my graph description. I also should have averaged the number of red alder for moisture readings that were the same in more than one quadrant. My study had 30 quadrants total along 3 transects, and I only included readings for quadrants that contained red alder for this particular graph. There were 14 quadrants containing red alder, with 14 soil moisture readings, however many had the same readings therefore I had 7 total points on the graph for soil moisture. What I should have done is if two quadrants had the same moisture reading, but a different number of red alder, I would have to average the number of red alder. I also learned that graphs are not supposed to have titles, which will help me with my final report.

Blog Post 7 – Theoretical Perspectives

User:  | Open Learning Faculty Member: 


Three keywords that describe the underlying processes of my research project are water stress, microclimate and competition.

My hypothesis is that red alder require higher soil moisture. Through observation of my study site, I found that red alder were often found closer to the river, which lead me to believe that there is higher soil moisture in this area. Throughout my research, I have found a number of ecological processes that relate to my research project. Not only is there evidence that red alder live in areas of high soil moisture, but they have a tolerance to flooding and intolerance to water stress.

I theorize that the river provides a microclimate consisting of increased water availability, increased light availability, and is a slightly lower elevation than other areas in my study. These conditions allow red alder to thrive right along the river’s edge and creates the perfect microclimate to increase red alder abundance and survival.

Throughout my research, I have found that red alder are good competitors, and are often found in areas that have been disturbed. As the river changes throughout the season, it is likely that red alder are able to handle flooding and erosion better than other species in the area. This would allow them to live closer to the river’s edge, and give them the upper hand compared to other species that require more stable conditions.


Post 2: Sources of Scientific Information

User:  | Open Learning Faculty Member: 


  1. The source of scientific information is an article titled Coordinated distributed experiments: an emerging tool for testing global hypotheses in ecology and environmental science by Fraser et al (2012).
  2. This source is classified as an academic review paper.
  3. I know this is an academic paper because the authors affiliated with Thompson Rivers University Department of Biological Sciences and Natural Resource Sciences, University of Western Ontario Department of Biology, and The University of British Columbia 3 Department of Botany and Biodiversity Research Centre. The article also has a bibliography and in text citations. This is a non-peer reviewed article because there is no acknowledgment of peer reviews.  Finally I know this is a review paper as it analyzes research that has already been conducted.

https://faculty.tru.ca/lfraser/fraser_et_al_2012.pdf

Post 1: Observations

User:  | Open Learning Faculty Member: 


Blog Post 1

   The area I have selected for my field research project is an approximately 0.021204 km^2 stretch of land surrounding my house. Located in Springwater Ontario the area is flat and has a dense boreal forest that sustains a rich biodiversity of insects, small mammals, reptiles, and birds. The ganaraska trail runs through this area along with a few other man made hiking trails. There are very few houses nearby meaning that with the exception of the trails, there is little to no evidence of human activity. 

   There is a seasonal pond that is approximately 0.015 km^2 of still water which has now turned into a field of lady ferns. The area around the pond is flat which makes the ground damp and muddy. After thunderstorms, which are common during Ontario summers, the pond and surrounding area floods. 

My site

The trail

The pond turned to lady fern field

First Visit 

  • June 29th, 11:34,  28*C, sunny with some cloud coverage, humidity of 55%
  • 44.51604 N, 79.746865 W 
  • Springwater Ontario
  • Boreal forest


Wildlife:

  • Garter snake (Thamnophis sirtalis)
  • American robin (Turdus migratorius)
  • Eastern Wood-Pewee (Contopus virens)
  • Fowler’s Toad (Anaxyrus fowleri
  • Chipmunk (Tamis striatus)
  • Ruby Throated Hummingbird (Archilochus colubris)
  • American Goldfinch (Spinus tristis)
  • Spotted Salamander (Ambystoma maculatum)
  • Deer Mouse (Peromyscus maniculatus)


Vegetation:

  • Alternate-Leaf Dogwood (Cornus alternifolia)
  • Black Spruce (Picea mariana)
  • Eastern White Cedar (Thuja occidentalis)
  • Jack Pine (Pinus banksiana)
  • Sugar Maple (Acer saccharum)
  • Blue Beech (Carpinus caroliniana
  • Paper Birch (Betula papyrifera)
  • Orange Lily (Lilium bulbiferum)
  • Lady Fern (Athyrium filix-femina)


Notes:

  • The pond has optimal conditions for mosquitoes to breed
  • There are 2 new fallen trees after the most recent thunderstorm
  • The presence of the snakes has led to a noticeable decline in mice and toad populations around the house
  • Robins nest with 3 eggs approximately 3ft off the ground in an Emerald Green tree
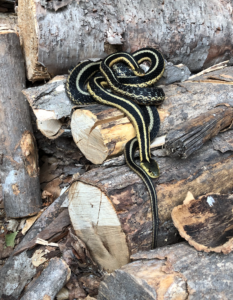
  •  4 Garter snakes that live in our wood pile
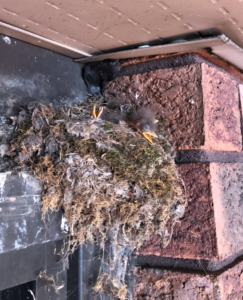
  • Eastern Wood-Pewee nest with 4 hatchlings on the back deck
  • I lifted up a small log that was blocking the trail and underneath was a Spotted Salamander
  • Many Fowler’s toads on walk to the pond

Eastern Wood-Pewee hatchlings

Garter Snakes

Questions:

  1. How does the weather affect the snakes behaviour?
  2. How long does it take for the baby birds to leave the nest?
  3. Is the soil more fertile at the pond than it is around the house?