Recent Posts

Post 3: Ongoing Field Observations

User:  | Open Learning Faculty Member: 


The biological attributes that I intend to study are the species richness and abundance of forbs between the riparian, transitional, and upland zones of eastern bank of the South Saskatchewan River.

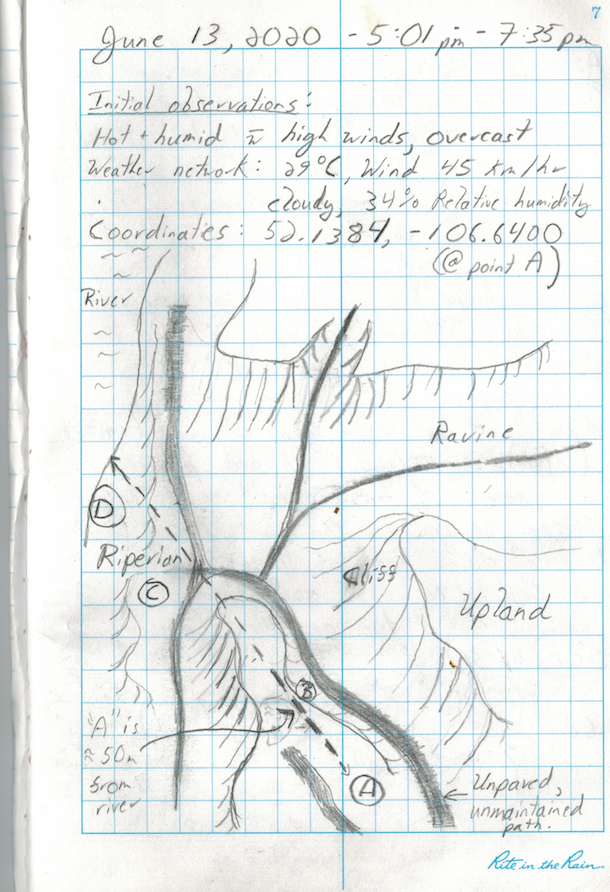
On June 13, 2020, I chose four locations adjacent to an overgrown pathway leading down, from the upland region (at the coordinates of 52.1384, -106.6400), towards the South Saskatchewan River. Based upon preliminary observations, each of the four locations (A, B, C, and D) (Fig. 1) have their own distinct vegetation structure. I have chosen to focus in on forb species because of the striking difference between species and abundance at each location. In addition, forbs appear to be present in each location; the same cannot be said for shrubs and trees (with shrubs occurring in high abundance in the upland and trees occurring in moderate abundance towards the river. Furthermore, based on these observations, species richness of forbs appears to be highest in the middle of the riparian zone, and lowest along the river and in the upland.

Therefore, I hypothesize that the distance between the river and the uplands influences the community structure of forb species. Along those lines, I predict that the richness and abundance of forbs will increase approaching the centre of the riparian zone. A potential response variable is the species richness and a potential explanatory variable is elevation. Both species richness and elevation are continuous variables.

Figure 1: The figure above is a drawing of the topography of the four sites (A, B, C, and D) that I have selected to observe the species richness and abundance of forbs.

Blog post 4: Sampling Strategies

User:  | Open Learning Faculty Member: 


My results for the forest community Snyder-Middleswarth Natural Area are as follows:

My fastest estimated sampling time between all three strategies was area haphazard sampling at 13 hours, following with random sampling at 13 hours and 19 minutes, and longest estimated time with systemic sampling at 15 hours and 7 minutes.

Overall, the sampling strategy with the most accuracy for me was the area haphazard which really surprised me. Systemic sampling had the worst overall error percentage while the random sampling was in the middle. For the two most common species the most accurate to the least accurate sampling strategies was (1) random, (2) haphazard, (3) systemic. For the two rarest species we have, from most accurate to least, (1) haphazard, (2) random (3) systemic.

The accuracy for all strategies were best with common species and higher margins of error for the rarest species. Below are the statistics for the percentage error with each strategy.

Area Haphazard (most common to least common)

EASHEM: 16%

SWEBIR: 23%

STRMAP: 77%

WHIPIN: 90%

Area systematic

EASHEM: 48%

SWEBIR: 72%

STRMAP: 100%

WHIPIN: 100%

Area random

EASHEM: 9%

SWEBIR: 25%

STRMAP: 78%

WHIPIN: 100%

Blog Post-9

User:  | Open Learning Faculty Member: 


The study of my research project was straightforward, but I did have to slightly modify my experimental design to make my conclusion stronger by collecting more data. I also have to study behaviour of different species of birds in order to relate to the specific habitat , in which I came across some unknown bird species which can be more interesting to study for future studies.


Post 2: Sources of Scientific Information

User:  | Open Learning Faculty Member: 


A) Frederick J. Swanson, Sherri L. Johnson, Stanley V. Gregory, Steven A. Acker, 1998, Flood Disturbance in a Forested Mountain Landscape: Interactions of land use and floods, BioScience, Vol 48, No. 9, pp. 681-689, https://doi.org/10.2307/1313331

B) The paper is academic peer-reviewed review material.

C) The paper acknowledges reviews from “Rebecca Chasan, Penny Firth, Seth Reice, and an anonymous reviewer” before it was published, and the author’s use evidence from other people’s field studies rather than studies of their own, which indicates it is review rather than research material.

Post 1: Observations

User:  | Open Learning Faculty Member: 


June 1st 2020

The chosen study area is a roughly 400-metre stretch of riparian zone along the western shore of Nita Lake in Whistler B.C. The shoreline varies between steep and gentle inclines from the waters edge up to the train tracks which run parallel approximately 20 metres from the shoreline. The shoreline topography varies between steep terrain with large semi exposed stone boulders that are patchily covered in thin (2-inch) layer of coarse fast drained topsoil, and lower lying areas with deep, spongy and moist soils covered by a thick layer of decaying detritus. The vegetation is a mix of red alder, western red cedars, western hemlocks, and the very occasional Sitka spruce. Red alder trees appear to be the most dominant species closest to the waters edge, and grasses and young red alders are the only vegetation found in the lowest lying areas.

Large trees, (over approximately 6 metres tall) appear only to on the higher ground, with the exception of some older red alders by the water’s edge. Over the other side of the railway there is extensive forest with western red cedars, western hemlocks and Douglas fir.

The lake became fully unfrozen in early April, and stream flow into the lake progressively increased, peaking in late May. The Lake water level rose approximately 40cm between early April and late may, and has since subsided by around 20 cm. At peak water level some areas of lower lying vegetation were submersed.
Weather: I visited the site at 4pm, and the weather was overcast, with a temperature of 12C.

Questions:
1. Are red alder the most dominant species in low lying, waterlogged and flood prone areas?
2. Are Western Red Cedars, Western hemlocks and Sitka spruce better suited to fast draining soils?
3. Young red alders (mostly less than 1 metre in height) appear to be abundant in the low lying areas. Are they a pioneer species after flood events?


Blog Post 4

User:  | Open Learning Faculty Member: 


For this tutorial I used the distance-based methods for sampling in the Snyder-Middleswarth Natural Area. In looking at the results of the three different sampling methods used for this exercise, the fastest estimated sampling time came from using random sampling method.


1)Simple Random

  • Eastern Hemlock- (537.1-469.9)/469.9 *100 =14.3%
  • Sweet Birch – (121.6-117.5)/117.5 *100 = 3.5%
  • Striped Maple – (30.4-17.5)/17.5 *100 = 73.7%
  • White Pine = (0-8.4)/8.4 *100 = 100%

2) Systematic

  • Eastern Hemlock = (310-469.9)/469.9 *100 =34%
  • Sweet Birch = (87.4-117.5)/117.5 *100 = 25.6%
  • Striped Maple = (31.8-17.5)/17.5 *100 = 81. 7%
  • White Pine = (0-8.4)/8.4 *100 = 100%

3) Haphazard

  • Eastern Hemlock = (490.4-469.9)/469.9 * 100 = 4.4%
  • Sweet Birch = (129.5-117.5)117.5 *100 = 10.2%
  • Striped Maple = (9.3-17.5)/17.5 * 100 = 46.9%
  • White Pine = (9.3-8.4)/8.4 *100 = 10.7%

The most accurate sampling strategy for the most common species and least common species was haphazard sampling. For the second most common species the most accurate sampling method was simple random, and for the second least common species the most accurate was haphazard. In all three methods the accuracy dropped as species abundance dropped. Surprisingly, haphazard sampling appears to be the more accurate strategy in this situation. However, I do not understand why an estimated value would ever be exactly 0. Would there not always be a slight chance of the above species occurrence regardless of sampling method?


Blog Post-8

User:  | Open Learning Faculty Member: 


I had no difficulties in organizing, aggregating or summarizing my data. The outcome was also what I expected. Also, I came to a conclusion that birds do exhibit different feeding habitat s and they do it in order to avoid interspecific competition. My data was collected only over the starting of summer season. In order to learn more I would like to explore any changes that may occur in the abundance and abundance aspect relationships as different food varieties or different weather.


Blog Post-7

User:  | Open Learning Faculty Member: 


My project discuss a detailed study of why birds feed at different habitat s when there is food available to them. And if they exhibit different feeding habitat is what makes them do so. This study focused on common songbird species of various sizes and shapes. The theoretical aspects of my project are that species that are greater in size feed on the ground to conserve energy and the species that are smaller in size but are dominating feed at the feeder and the other ones mostly feed away from the feeder. My research is underpinned by idea such as interspecific competition, adequate weather for the birds to come out of their places. Some key words that could be used to describe my project are bird species and their different feeding habits

Blog Post -6

User:  | Open Learning Faculty Member: 


I started collected my data in month of April, during clear and sunny afternoon days. It was a very warm and windy day here in Vancouver Island. I just sat in observable distance from the feeder and spent an hour to collect the data. In order to thoroughly collect data, I decided to double the number of samples i.e. total 10 samples (days) in my final data and made replicates by including another feeder at my friend’s backyard in order to get supportive data for my hypothesis.  Before starting my sampling, I put the feeder for one day in order to let know the birds about it which I believe this simple adjustment helped me maintain a greater quality of samples and helped me record more bird species. I did not observe any new patterns during this exercise though I observed a unknown specie of bird so I named it as “unknown specie A”. The data collected seems to support my hypothesis.

Blog 2: Sources of Scientific Information

User:  | Open Learning Faculty Member: 


For this Blog post I chose to use TRU’s online library database to search for an article. The article I chose is called Succession after reclamation: Identifying and assessing ecological indicators of forest recovery on reclaimed oil and natural gas well pads.

a) The source is from the journal ‘Ecological Indicators’ through the publisher Elsevier. Click here for link

b) I determined that the category of information source for this article is Academic Peer Reviewed Research Material.

c)I determined it is academic because it was written by experts in the field from the University of Alberta and the Alberta Environment and Parks, contains in-text citations, and a bibliography. It is academic research material as it contains a ‘Methods’ and ‘Results’ section.

I concluded that it is peer-reviewed not because the author(s) directly stated it in their ‘Acknowledgement’ section but because the publishing company Elsevier by which this article was published states on their website that they are the “leading platform for peer reviewed literature” (Elsevier, 2020). The authors did however thank, by name, the multiple people involved in the project.


Sources:

Elsevier. Retrieved from: elsevier.com/solutions/sciencedirect/content