Recent Posts

16 Oaks Community Garden – Vancouver, BC

User:  | Open Learning Faculty Member: 


Hello Professor Hebert and classmates of Biology 3021 and welcome to my blog posts for my selected ecology field research project.

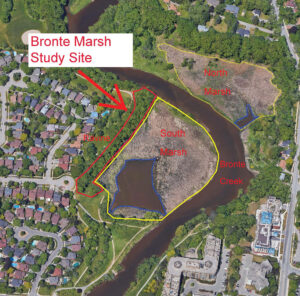
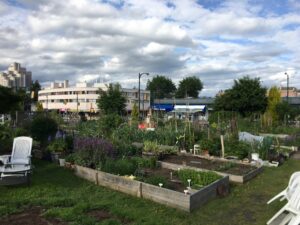
I’ve selected a private urban community garden in the City of Vancouver, known at 16 Oaks Community Garden. This area is located on private land and is used by garden members who join at-will, including administrative costs and required labour requirements for remaining in good standing for membership.

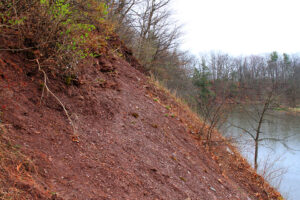
Here is a photo looking northeast across the garden towards the intersection of Oak St. and W. 16th Ave.

My initial research topic(s) is as follows and will be narrowed as data is gathered in addition to input from classmates and instructors.

  1. Novel biodiversity study of insects in this Urban Community garden ecosystem
  2. Novel biodiversity study of invasive insects in this Urban Community garden ecosystem
  3. Novel biodiversity study of native insects in an Urban Community garden ecosystem in a location with potential contaminants of concern (PCOCs)


The location of this garden is at the intersection of W. 16th Avenue and Oak Street in Vancouver, British Columbia. The coordinates are as follows:

49° 15′ 24″ N 123° 7′ 40″ W

The garden’s relative elevation is 60m. This data was collected using the Compass application native to the iOS operating system 13.4.1 on 2020-05-31 at 18:02:00.

The time of data collection was 18:01:01, with the date being 2020-05-31. Weather at time of initial survey was partly cloudy with full sun. There was a breeze of unknown speed in the direction of northeast.

The current season is this hemisphere is Spring and the temperature was 19.4°C, collected using a standard household meat thermometer placed in open air and allowed to condition to surrounding environment for approximately10 minutes.

Using a standard 30m length survey tape, the approximate dimensions of the square garden is 34.8m along Oak Street, and 34.67m along W. 16th Avenue. The total area of the garden is approximately (34.8m x 34.67m) = 1207m^2.

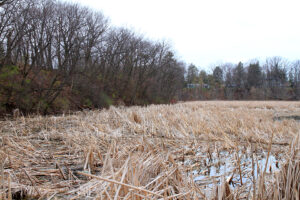
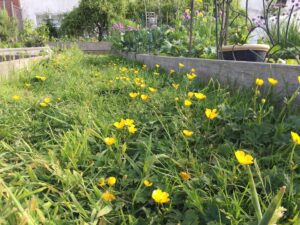
The topography is ungraded, sloping and undulating in areas where draining is incomplete. Overall the community garden slopes toward the northeast. The land is covered in a mix of grass, clover and wild flowering plants, with the inside perimeter lined with a mix of low brush, flowers and occasional trees. Throughout the internal garden there are raised and ground-level garden beds. These beds consists of fruits, flowers, and vegetables. Absent of human input, the garden most closely resembles a meadow ecosystem.

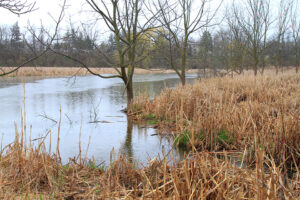
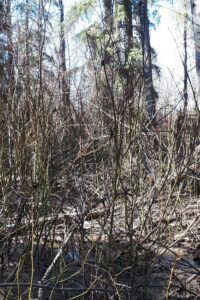
Here is a photo of some suspected meadow buttercup, or Ranunculus acris L. growing between garden beds (Klinkenberg, 2020).

Thanks for your time and attention and I hope you’ll stay tuned to this exciting research project focused on biodiversity in urban ecosystems.

References:

Klinkenberg, B. (2020). E-Flora BC: Electronic Atlas of the Flora of British Columbia. Lab for Advanced Spatial Analysis, Department of Geography, University of British Columbia.

Post 2: Sources of Scientific Information

User:  | Open Learning Faculty Member: 


The source of scientific information I have chosen is a study on the abundance of marsh birds that inhabit the marshlands of the Great Lakes. This scientific paper is an important source of information that I can use as part of my research project as my study site is within a marsh that is connected to Lake Ontario. The paper was accessed from: https://longpointbiosphere.com/download/Birds/Timmermans-Badzinski-Ingram-2008-Marshbirds-GL-Hydrology.pdf

This is an academic peer-reviewed, research paper. The paper was written by experts in the field of both ecology and hydrology. It has a methods, analysis, and results section, with in-text citations and an extensive bibliography. As well, the paper cites two reviewers in the acknowledgment section.

I determined this using two reference materials. The tutorial link, How to Evaluate Sources of Scientific Information in Module One of this course has a flow chart that goes through steps of how to determine the four different categories of information sources. This paper falls in the category of an academic peer-reviewed, research paper by following the criteria through the flow chart. I also referred to the Module One reading of A beginner’s guide to reviewing manuscripts in ecology and conservation (Lepczyk and Donnelly, 2011). This paper provides a more thorough discussion on how to review scientific information sources. Within this paper, there is a figure (Box 1) that provides a quick reference guide for reviewing an information source. Based on this guide, I determined that it was an academic peer-reviewed, research paper as most of the criteria could be answered with a ‘yes’.

References

Lepczyk, C. A. & Donnelly, R. E. (2011). A beginner’s guide to reviewing manuscripts in ecology and conservation. Ideas in Ecology and Evolution, (4) 25-31. doi: 10.4033/iee.2011.4.4.c. CC BY 3.0

Timmermans, S.T.A., Badzinski, S.S., Ingram, J.W. 2008. Associations between Breeding Marsh Bird Abundances and Great Lakes Hydrology. Journal of Great Lakes Research, 34:351-364. Accessed from: https://longpointbiosphere.com/download/Birds/Timmermans-Badzinski-Ingram-2008-Marshbirds-GL-Hydrology.pdf

Blog Post-5

User:  | Open Learning Faculty Member: 


At the very beginning it was difficult for me to implement randomization in collecting data, however other than that there was no difficulty in collecting the data as I was using random sampling strategy. The data collected wasn’t surprising as it seems to be supporting the hypothesis. In order to modify the approach, I kept on collecting more data to get better results to support the hypothesis and make the conclusion stronger. The only difficulty for me to collect the data was the weather as birds don’t get out of their place in every weather and the area where I am living the weather changes really quick.


Blog Post-4

User:  | Open Learning Faculty Member: 


For the Virtual Forest Tutorial i sampled the Snyder-Middleswarth Natural area using area-based systematic, random, and haphazard methods. The technique with the fastest sampling time was the area-based systematic approach with a sampling time of 12 hours, 5 minutes, while random and haphazard techniques had sampling times of 12 hours 34 minutes, and 12 hours 36 minutes, respectively. The least abundant species showed the most accuracy in results, White Pine had a 0% error for two different methods, random and haphazard sampling strategies.

In general, the area-based random sampling technique was the most accurate for each species. Area based systematic sampling showed the least accuracy in results. For the two most common species the systematic approach gave the best percent error results, while the haphazard sampling gave the worst results. Alternatively, the percent error for the two rarest species was best using the haphazard sampling technique. It seems that the systematic approach is more useful for large amounts of common species, while the haphazard sampling was more accurate for the rarer species.


Below is a list of percent error for the two most rare species, Red Maple and White Pine, as well as the most common, Eastern Hemlock and Sweet Birch, for each sampling strategy.

Systematic:

Eastern Hemlock-45.4%

Sweet Birch-20.6%

Red Maple-82.5%

White Pine-50.0%

Haphzard:

Eastern Hemlock-25.0%

Sweet Birch-6.38%

Red Maple-22.6%

White Pine-0%

Random:

Eastern Hemlock-9.1%

Sweet Birch-6.38%

Red Maple-1.85%

White Pine-0%


Post 1: Observations

User:  | Open Learning Faculty Member: 


I have chosen Bronte Marsh as a study area. The marsh is a remnant coastal wetland area at the downstream limit of Bronte Creek before it flows into Lake Ontario. It is surrounded by urban development within the Town of Oakville, Ontario. Despite the urban development around the marsh, the Bronte Creek watershed is mostly undeveloped, with only 4% settled between urban and rural settlements (Conservation Halton, 2002). The marsh is bisected by Bronte Creek, with a total area of approximately 2.64 hectares on the south side of the creek and 1.63 hectares on the north side of the creek. The open water in the south marsh is approximately 0.53 hectares. The marsh is contained within a natural valley corridor/ravine with steep slopes that are predominately shale, with an exposed shale outcrop at the north limit of the valley slope, immediately upstream of the marsh.


For the purpose of this study, I have chosen to focus on the south marsh and the adjacent valley slope due to accessibility of this area. I frequently walk the south marsh area as it is close to home and it’s bordered by Riverview Park with a walking path adjacent to the marsh. The path traverses the top of the slope on the southwest side of the marsh, and adjacent to the open water area on the southeast side of the marsh. The north marsh is mostly inaccessible as it borders private property.

I conducted my initial site visit on April 30, 2020. I have provided observations below summarized from my digital notes from my mobile device. I have included my digital field notes and some photographs following these observations.

Date: April 30, 2020

Time on site: 18:45

Time off site: 20:15

Temperature / Weather: 10°C / Cloudy, light fog, changing to light rain

Observations

Wildlife- Visual

  • Blue Heron
  • Double-crested Cormorant
  • Mute Swan- nesting
  • Red-winged Blackbird
  • Common Grackle
  • Canada Goose
  • Beaver
  • American Robin
  • Grey Squirrel
  • Gull species
  • Horsefish- dead
  • Black-crowned Night-Heron
  • Red-necked Grebe- nesting

Wildlife- Audio

  • Red-tailed Hawk Flicker
  • Spring Peepers
  • American Toad
  • Northern Cardinal

Trees, Shrubs and Herbaceous

  • White Oak
  • White Pine
  • Red-osier Dogwood
  • Gray Dogwood
  • Sugar Maple
  • Ironwood
  • Basswood
  • Willow species
  • Black Walnut
  • Cattails

Invasive Species

  • Common Buckthorn
  • Vine species

Notes

  • Study area from south limit of ravine in Riverview Park to exposed shale valley wall adjacent to and including the marsh on the southwest side of Bronte Creek
  • The soil on the slopes was red shale with minimal ground cover
  • Large trees along full length of the ravine slope- mainly deciduous with mix of coniferous, many with tree cavities observed
  • Exposed shale valley wall with no vegetation at upstream limit of study site
  • Storm sewer outlet near north limit of study area
  • The most dominate understory was common buckthorn
  • Granular pathway west of the ravine varying in distance from 4 to 10 m from the top of the ravine slope
  • The marsh area was dominated by cattails with no Phragmites observed
  • The dominant wildlife observed in the marsh included red-winged blackbird and common grackle
  • A staff gauge was observed at the Marsh inlet/outlet with a depth noted as 0.58 m.
  • The water in the marsh and the creek was clear


As noted in the field notes, the marsh is dominated by cattails (Typha spp.) in the wetted areas with a surface area almost four times the surface area of open water. There was abundant wildlife observed with red-winged blackbirds being the dominant species. The water was clear with no offensive odour.

The upland area is a steep valley slope with a mainly deciduous canopy cover of white oak (Quercus alba), maple species (Acer spp.), and eastern white pine (Pinus strobus). The understory consists of native species such as gray dogwood (Cornus racemosa), red-osier dogwood (Cornus sericea), and invasive species including common buckthorn (Rhamnus cathartica) and climbing vine species (unidentified). The ground cover is very limited with minimal grasses and herbaceous species identified as part of this initial site visit.

Three questions that I find interesting from my observations include:

  1. How is the dominant understory of common buckthorn impacting the establishment of native understory/woodland species? What are the effects on the biodiversity of the ravine ecosystem as a result?
  2. How has the marsh maintained minimal to no impact by invasive Phragmites and what are ways in which it can be prevented from being impacted in the future?
  3. With the recent rise in Lake Ontario water levels, how does this affect the marsh ecosystem? More specifically, how might it impact the viability of breeding marsh birds or what sort of effects does it have on the aquatic vegetation?

References

Conservation Halton. 2002. Bronte Creek Watershed Study. Retrieved from: https://conservationhalton.ca/uploads/bronte_creek_watershed_study_-_a_-_final_-_2002.pdf

Caleb’s Blog Post 3: Ongoing Field Observations

User:  | Open Learning Faculty Member: 


The biological attribute I have chosen to study in my selected area is the distribution of tree species. My area is inbetween a bike path and a steep hill so I divided the area into 3 separate areas, the location beside the bike trail, the middle, and the location at the base of the hill.

I found that in each area, the dominant tree species was very different. The area beside the bike trail consisted of mostly evergreen trees like subalpine fir and engelmann spruce (see picture below).

In the middle area, the dominant speces was black cottonwood and aspen (see picture below).

In the area at the base of the hill, there was very little large trees and an abundant mix of small alder trees and willow plants were present (see picture below).

While walking through the gradient, I noticed that the amount of water flowing through the bases of the trees increased while getting closer to the base of the hill. I also know that evergreens prefer dry well drained soil and cottonwood and alder/willow will grow in wetter areas. Therefore, my hypothesis is that the distribution of the most abundant tree species in each area is dependant on the water content of the soil. My prediction is that the water content in the soil will be highest at the base of the hill and lowest beside the bike trail.

Based on my hypothesis, a potential response variable would be the dominant tree species of the area and one explanatory variable would be the water content of the soil. I will test this by taking soil samples throughout the gradient. This would be a natural experiment (because you cannot change the predictor variable) and this experiment would have a logistic regression design as the predictor variable is continuous (soil moisture) and the response variable is categorical (tree species). I would test the soil moisture by taking soil samples in each of the 3 areas using a distance-based sampling procedure. I would then measure the weight of the soil when wet, dry it out in the oven, then measure it when dry.


Blog Post 9: Field Research Reflections

User:  | Open Learning Faculty Member: 


Designing and carrying out an experiment as well as writing a paper utilizing a lot of academic research has given me much more of an appreciation and understanding of the scientific method and the development of ecological theory. Finding quantifiable patterns in nature is an extremely difficult task due to the amount of variables (confounding, hidden, and obvious ones) that are inherently affecting everything, and the difficulty in creating a controlled sample area outside of a lab. The study design was a lot more important and difficult to create than I had previously thought it would be. It took me forever to figure out what I wanted to study and how I could actually quantify an observable pattern. But once I finally figured out what to do, I had a great time designing and developing my own research project. It was an exciting experience to be allowed to focus on a project of my own design that reflected my own interests. I did have to change my design along the way, as I had to slightly move the locations of my study zones to minimize confounding variables (which through more research realized I may have not even succeeded in doing). In the end I should have researched a lot more about the method I was going to employ for the data collection in order to increase the accuracy of my results. I learned a lot about the limitations of what you can infer from your research. In the beginning I thought I could show direct relationships between certain variables (nutrition, cover), that after more research found that I did not really have data to directly support those relationships at all. This inspires me to continue learning more advanced chemistry and biology in order to one day hopefully employ certain advanced techniques in sampling and analyzing data. I learned a lot about the natural history of the Roosevelt elk and the Columbia black tailed deer, as well as their relationship with the forestry industry in BC in the process of this study. I am now more interested in wildlife and forest biology than I was before taking this course.

Blog Post 5: Design Reflections

User:  | Open Learning Faculty Member: 


For module three I needed to collect plant biodiversity data up a slope which began at the creek that ran through my site. The goal was to see how plant diversity changed as you moved away from the water source. My approach to doing this was systematic and involved taking a transect line surveying 1×1 metre quadrants in succession up the slope. I left a meter spacing between quadrant surveyed. My method was pretty straight forward and I didn’t really have any difficulty since I could choose exactly where I wanted the transect to be within the previously observed site. I do foresee an issue with access however if I take the same approach with the larger project, which will likely involve setting the transect at a particular distance from the last, if the chosen distance ends up being somewhere which takes me into thick brush. Other than that possibility, the strategy seemed to work well to gather the data I wanted, which coincided with my previous observations and prediction. The man made gravel path at the top of the slope however seems to have it’s own affect on biodiversity and will need to be controlled for in my final project. One way I’m thinking of doing this is by also surveying sites on the opposite side of the stream as well where a gravel path does not exist, and looking for patterns in the differences. This way I can determine how much, if any, effect the path is having on my predictions.

Blog Post 8: Tables and Graphs

User:  | Open Learning Faculty Member: 


I created a graph to illustrate my species richness of shorebirds data, collected at the three different sampling locations at the San Francisco Bay Wildlife Refuge. These three different sampling locations correspond to 3 varying levels of human presence. Hence, this graph depicts shorebird species richness across a gradient of human presence at the wildlife refuge. I didn’t have any difficulties organizing, aggregating or summarizing this data. The outcome was what I expected in regard to the average species richness of shorebirds across the human presence gradient, however, the results between Location #1 and Location #2 are significant, so I would like to collect some more data to see if significance will be reached with a larger sample size.

Blog Post 7: Theoretical Perspectives

User:  | Open Learning Faculty Member: 


For my research project, my hypothesis is that increasing levels of human presence leads to a decrease in shorebird diversity measures at the San Francisco Bay Wildlife Refuge. This hypothesis might touch on ecological processes such as intolerance of shorebird species (local to the refuge) to urban life or human presence. Specifically, intolerance of shorebird species to human presence or urban life may arise from associated phenomena such as habitat disturbance, noise or pollution. The observation of such phenomena at the wildlife refuge and their observed correlation with observed levels of human presence or urbanization underpin this research. My initial observation of shorebird diversity decreasing across the observed increasing urbanization or human presence gradient also underpins this research.