Recent Posts

Caleb’s Blog Post 2: Sources of Scientific Information

User:  | Open Learning Faculty Member: 


For my source of ecological information I chose a journal article from Ecology (journal).

Poorter, L., L. Bongers, and F. Bongers. 2006. Architecture Of 54 Moist-Forest Tree Species: Traits, Trade-Offs, And Functional Groups. Ecology 87:1289–1301.

Here is the link to the article:

https://www-jstor-org.prxy.lib.unbc.ca/stable/20069069?seq=2#metadata_info_tab_contents

This is a peer-reviewed, academic research paper from Ecology (Ecological Society of America or ESA). It has a materials and methods, results, conclusion, acknowledgments and literature cited section. The journal (Ecology) only accepts peer reviewed articles and reports.

I confirmed this journal is peer reviewed  by looking at this link:

https://www.esa.org/publications/

In the Impact Factors section of this web page close to the bottom it states: “Through its well regarded peer-reviewed journals, the ESA publishes high-quality research and analysis from the ecological community”.

Blog Post 1 Observations

User:  | Open Learning Faculty Member: 


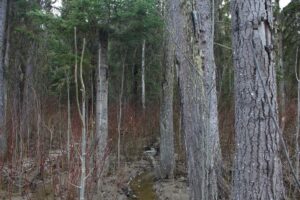
The area I selected to observe is a low-lying (currently very wet) forested area. It’s approximately 2 acres in size and completely flat. It is located beside a bike trail in Prince George, BC in the southern part of the city at the base of the hill going up to the University of Northern British Columbia. The exact coordinates are 53° 54′ 13.0874″ N and 122° 48′ 33.678″ W taken from Google Maps.  I visited the site on April 27th, 2020 at 5 PM. The temperature was 12° celcius and it was overcast and rainy. You can see all this information in Fig 1.

The vegetation is mostly trees and some bushes and shrubs that I’ll be able to more easily identify once they grow berries and leaves.

The species of trees I observed were:

  • Engelmann Spruce
  • Subalpine Fir
  • Douglas Fir
  • White/Paper Birch
  • Black Cottonwood
  • Trembling Aspen

The oldest/biggest trees in the area were engelmann spruce and douglas fir. In terms of water, if you look at Fig 2 you can see there are many small streams running through the sandy/muddy ground. I had to wear rubber boots while traversing through the area. I’m assuming this water is mostly snowmelt, as none of the streams have any rocks or any other signs of being there all year. There was no sign of any animal tracks (only dogs) or any birds.

Some thoughts on research questions (mostly centered around my main interest, trees):

  1. How did the evergreen trees grow here succesfully with how wet and muddy the ground is?  What changes occur to this area once there is less water? What is the main type of soil here? I can check this by choosing an area and digging a hole once the water dries up.
  2. I’d like to research succession of this small area of forest. What is the average age of the oldest and biggest trees in this area? I don’t have a increment borer but once I confirm the species I can use rough calculations of diameter and the growth factor of that specific species to determine this. I would like to inventory and name the 10 oldest trees with the largest DBH in this small area. What species are going to succeed the older trees once they die? Or is this possibly a climax forest?
  3. What species of animal frequent this area? What does the presence of these animals tell me about the ecosystem? From my first observations I didn’t look for animal tracks but in my next visits I can look for tracks and scat.

Fig 1.

Fig 2.

Blog Post 9: Field Research Reflections

User:  | Open Learning Faculty Member: 


The fieldwork this class has allowed me to perform was very engaging and motivating in my biology undergrad journey. I enjoyed applying all this theory to my field research. It gave me a glance at what this biological work I have been dreaming of is all about. Conducting my own study was a challenge. It was the first time I had ever done a full project of this sort fully by myself. I loved the freedom we had in the beginning as to what we would be studying. Having very limited experience in research, I had a few flaws in my initial plans. For example, my first ideas were way too grandiose and hopeful. I quickly understood the extent of the work necessary to drive research in the field. What I loved about this, is that it motivated me for future potential larger-scale studies in my career instead of simply discouraging me. I lowered the scale of my research here in order to create quality work but I simply cannot wait to participate in larger, more important work. Another flaw my initial plan had was the lack of a control in my idea of assessing the gradient in flower abundance. I have greatly learned from this experience and as I said cannot wait for the next. I greatly appreciated the systematic way ecological work is done. I believe that to understand such an intricate system that is a community or an ecosystem, empirical work is necessary to formulate a more informed guess as to what is really going on. I think the scientific method is a great way to understand greater scheme problems and ecology showed me a fun way to systematically work on a problem as complicated as a field full of seemingly random flowers. I love finding patterns!

Blog Post 9

User:  | Open Learning Faculty Member: 


The creation and implementation of an experimental design was a new experience for me. I had a pretty difficult time coming up with a design, and went through a few versions of experimental design to test my hypothesis. When I finally did come up with a feasible experimental design, I did not find it difficult to implement.

While I definitely have an interest in ecology, I think it is just that; an interest. I definitely gained an appreciation of ecological theory, but I will not be taking part in a career that leads me down that road.

I struggled immensely with all of the literature reviews involved in my study. I am more of a hands-on type of person, not designed to read peer-reviewed articles. I think I’ll stick to firefighting for a bit, and then re-join the military. Thanks BIOL-3021, you made the decisions for my future easier.


Blog Post 8

User:  | Open Learning Faculty Member: 


Trail selection by Odocoileus hemionus in an open field at varying snow depths  

Plot  Plot Mean Snow Depth  Individuals Present in Plot  Aggregate Distance Travelled on Established Trail 


Aggregate Distance Travelled on Primary Trail 


Aggregate Distance Travelled on Secondary Trail 


Percent Distance Travelled on Established Trail 


Percent Distance Travelled on Primary Trail 


Percent Distance Travelled on Secondary Trail 
1  37.90cm  8  N/A  189m  51m  N/A  78.75%  21.25% 
2  31.65cm  10  N/A  185m  115m  N/A  61.67%  38.3% 
3  31.60cm  4  N/A  110m  10m  N/A  91.67%  8.3% 
4  30.70cm  7  N/A  165m  45m  N/A  78.57%  21.43% 
5  37.8cm  12  N/A  306m  86m  N/A  78.06%  21.94% 
1  48.52cm  10  267m  0m  33m  89.0%  0%  11.0% 
2  38.27cm  9  222m  40m  8m  82.22%  14.81%  2.96% 
3  38.30cm  2  60m  0m  0m  100%  0%  0% 
4  37.50cm  6  153m  5m  12m  90.0%  2.94%  7.06% 
5  48.28cm  12  N/A  326m  49m  N/A  86.93%  13.07% 
1  65.15cm  11  300m  30m  0m  90.91%  9.09%  0% 
2  55.68cm  8  160m  80m  0m  66.67%  33.33%  0% 
3  55.68cm  4  12m  0m  0m  100%  0%  0% 
4  53.95cm  5  87m  33m  0m  72.50%  27.50%  0% 
5  64.98cm  9  N/A  219m  36m  N/A  85.88%  14.12% 
1  73.10cm  11  290m  40m  0m  87.88%  12.12%  0% 
2  63.38cm  11  226m  80m  24m  68.48%  24.24%  7.27% 
3  63.40cm  3  82m  0m  8m  91.11%  8.89%  0% 
4  62.08cm  8  96m  44m  40m  53.33%  24.44%  22.22% 
5  73.0cm  7  N/A  122m  50m  N/A  70.93%  29.07% 

I did struggle a bit to organize all of the data seen in the above table. This was primarily due to my field notes. My terminology was inconsistent in my notes, and it took me quite some time to go through all my notes and essentially translate them in to something that I could use to create a table. The table really helped clarify the date, in my opinion. Attempting to explain in text the above data would have been extremely confusing.

The outcome was not exactly what I expected, but it supported my hypothesis. There was more use of primary trails than I anticipated, but established trails were still used the most frequently. In table 2 (not shown) the data shows that in warmer weather, and a less dense, melting snow pack, use of secondary trails ceased. Deer ceasing to use secondary trails at a threshold depth was in my hypothesis, but no data that I collected supported this. A further area of study that the data made me think about would be to explore the effects of snow density and penetration through snowpack on mule deer trail selection.

Blog Post 7

User:  | Open Learning Faculty Member: 


My study is concerned primarily with trail selection by mule deer at varying snow depth in an open field, with my hypothesis being that as snow depth increases, mule deer will increasingly lessen their use of secondary (newly created) trails and increase their use of primary (previously created) trails and established trails -in this case, anthropogenically created snowshoe trails. The underlying ecological processes of my hypothesis are energy conservation, adaptation to human activity, habitat selection, community dynamics, behavioural plasticity, and perhaps nutrient cycling. This last process will not be explored in my study, but as winter is such a tough time for deer, energy expenditure and conservation are very important. That means that the selection of trails through deep snow could potentially be the deciding factor in their survival. Furthermore, I believe, and explore a little bit in my study, that deer are travelling through my study area between bedding areas and browsing areas in adjacent agricultural land. The nutrients from the agricultural land are no doubt sustaining the deer population in the area, and their decision to travel through the open field of my study area must mean they obtain from there is worth the energy expenditure of the travel.

Three keywords for my study could be behavioural plasticity, anthropogenic disturbance exploitation, calorie expenditure.

Blog Post 6

User:  | Open Learning Faculty Member: 


My field data collection activities have gone well. After initial difficulties wrapping my head around how to actually test my hypothesis, I came up with what I believe to be a feasible experimental design.

Over the course of three months, I surveyed five plots in my study area. I chose random days to collect data, based on snow fall. After a period of snowfall, I would survey all five plots as soon as it got light enough to see in the morning. I measured temperature upon arrival with a Kestrel pocket weather meter. A survey would consist of measuring snow depth at the plot, removing my snowshoes too make less of an impact in the plot, counting mule deer tracks on the established snowshoe trail present in plots #1-#4, measuring snow depth of the established trail, counting mule deer tracks in both primary and secondary trails, and measuring the snow depths of each trail encountered in a plot. Before leaving a plot, I would re walk the established trail wearing my snowshoes a few times to ensure it was re-compacted. I surveyed all five plots six times between January and April.

The hardest part was accurately counting mule deer tracks on the established trail, as I would often have to observe several 60cm long grids to accurately count the deer tracks. In the -20C weather, this was a bit tedious-feeling some mornings.

I tried to keep my design fairly simple, and once I had switched from transects to plots, I had no issues implementing my design. I did not notice a threshold depth at which deer completely ceased to use secondary trails, as per my hypothesis. I am, however, fairly confident that at some point snow depth would become too great for deer to travel select travelling outside of an established or primary trail. It is impossible to say though in my study, as snow depth never reached a depth at which secondary trail travel completely ceased.

Blog Post 5

User:  | Open Learning Faculty Member: 


My initial experimental design and strategy took some significant re-thinking. After initial data gathering session in my study area, I realized I was unable to gather accurate enough data that I could then compile in a useful way. I therefore decided to switch from surveying for mule deer prints using transects, to using a plot system.

The problem with the transect system I originally planned to use was that I would have been unable to accurately monitor any individual trail created by mule deer through the snow. That is to say, keeping track of what I defined primary trails and secondary trails in my report would have been very difficult. Also, I believe transects would have provided better randomization, but made it difficult to accurately count individual deer tracks.

So, I switched from transects to five plots, four  of which had a anthropogenic snowshoe trail that ran the length or width of the plot. I surveyed for mule deer presence in the plot by counting individual tracks. I counted tracks on the established anthropogenic trail, on well used, previously created deer trails (primary trails), and on newly created trails (secondary trails).

Blog Post 2: Sources of Scientific Information

User:  | Open Learning Faculty Member: 


Impact of modified tillage on runoff and nutrient loads from potato fields in

Prince Edward Island

R.J. Gordona, A.C. VanderZaaga,d,∗, P.A. Dekkera, R. De Haanb, A. Madanic

This is a peer-reviewed, academic research paper.

All the authors are affiliated with a university/school or a research facility:

  • School of Environmental Sciences, University of Guelph, 50 Stone Rd. East, Guelph, Ontario N1G2W1, Canada
  • Prince Edward Island Department of Agriculture, Forestry and Fisheries, Charlottetown, Prince Edward Island, Canada
  • Nova Scotia Agricultural College, Truro, Nova Scotia, Canada
  • Agriculture and Agri-Food Canada, Ottawa, Ontario, Canada

The paper contains methods, results, and a conclusion.

It includes in-text citations and a bibliography

It is peer-reviewed-As Science Direct is a peer-reviewed publication. From their website:

ScienceDirect is Elsevier’s platform of peer-reviewed scholarly literature.

The article does acknowledge:

Acknowledgements

This research was funded by the Canada/PEI Water Supply Expansion Program. The funding agency had no involvement in the study design, analysis, interpretation, writing, or publication.


Blog post 3

User:  | Open Learning Faculty Member: 


I planned on studying niche partitioning among birds as  niche partitioning theory explains that the species can co-exists in the environment in order to reduce the interspecific competition. This study focuses on the feeding habits of the different bird species and recording their behavior on the feeder. A feeder with sunflower seeds was put outside to record the observation in different niches i.e. 1) whether the birds prefer to stay at the feeder and eat their food right away, or 2) the birds come to feeder and take away the food with themselves or 3) birds look at the ground and eat the food that might have fallen off from the feeder. Location I choose is my backyard and for the replicates I am also observing the same in my friend’s backyard. Both the locations have same vegetation.

Research question- Do birds at a feeder exhibit different feeding niches?

Research Hypothesis- The birds at a feeder exhibit different feeding niches.

Prediction- If the birds exhibit different feeding niches then the individual species will be observed feeding more often in one of three niches.