Recent Posts

Blog Post-2

User:  | Open Learning Faculty Member: 


Cloyed,C.S., & Eason, P.K., (2017). Niche partitioning and the role of intraspecific niche variation in  structuring a guild of generalist anurans. Royal society open science.,https://doi.org/10.1098/rsos.170060


The paper I choose  “Niche partitioning and the role of intraspecific niche variation in structuring a guild of generalist anurans” by Cloyed, C.S., & Eason, P.K. This is an academic, peer-reviewed research article published in the Royal society open science. It has a materials and methods, results, conclusion, acknowledgments and literature cited section.The article includes footnotes and citations all cited at the end, and was reviewed by Bryan Hayden and one anonymous reviewer. This paper gives me more depth about studying niche partitioning among birds though this paper examined niche partitioning within a group of five anurans and determined whether variation within species could facilitate resource partitioning.  As their study concludes that these species partition their niches by feeding at different trophic levels and foraging at different distances from ponds.

Blog post-1

User:  | Open Learning Faculty Member: 


The study area chosen for the field study is backyard of my house and backyard of my friend’s house, in Courtenay, Vancouver Island, BC. Both the backyards are around 4.7km away . Both the areas are rich in bare ground, small gardens.  At both the backyards there is one big tree which is used to hang my feeders on. Both the areas are same in terms f vegetation. It is a residential area with flats and buildings. I initiated this research project to identify the key ecological features of most abundant local birds’ species in this area and to study their feeding habits and recording their behavior. I started observing the birds in both the areas  in starting of April month (15-17 C temperature), during the noon time when there was adequate sunlight in order to the abundance of different bird species. As I am focusing on studying the different habitat partitioning among birds or niche partitioning (the word niche basically means the role and the position a species has in its environment) which they undergo to reduce competition, another question can arise on seed preferences by providing 8 different types of seeds and record the most preferred ones or some birds eat at different times of day to reduce competition. These all are questions that came across during the study.

Post 6- Data Collection

User:  | Open Learning Faculty Member: 


I collected all my data over the course of two days this past week. I made 5ha boundaries on three zones in my study area (80 year old second growth Douglas Fir plantation, Riparian zone, and 18 year old harvested early succession) and randomly generated 10 GPS points within each area. I had numbered them so that I would navigate to the nearest next point to alleviate the frustration I encountered having to walk the same area twice as I did during the test trial the day before. I had spent some time studying how to estimate percent cover of vegetation and I had bear bangers this time. I encountered patterns that reflected my hypotheses: the black tailed deer sign was most abundant in the forest and the elk sign was most abundant in the grassy wet riparian zone. It’s likely I have enough data to show some correlation with deer and shrub abundance, but it seems more likely that the deer are more abundant in the forest because there is more cover from salal shrubs for security reasons not for food reasons, whereas there is not as much sign in the open harvested area due to risk factors associated with predation and less browse (although I imagine nocturnally they are slightly more active in this area). Why the deer spend less time in the wet riparian zone is not clear to me yet, and may be something to do with niche and resource partitioning with the elk (though I’m uncertain the elk population is large enough for this to be a factor). The elk sign it seems was correlated with the presence of high cover of grasses in the riparian zone, but I also found sign in both other areas leading me to believe they also feed on shrubs as they traverse the landscape, but prefer to stick to areas when there are suitable grasses to feed on.

Post 5- Design Reflections

User:  | Open Learning Faculty Member: 


I performed the trial data collection a few days ago and found a few kinks in my design. I realized there a confounding variable in one zone (the second growth Doug Fir forest). There were a few mountain biking/dog walking trails that fragmented the area and the plot data that I collected in this section of the forest was completely absent of any ungulate activity at all (no old trails or anything), which is abnormal in my experience. As I continued to collect data and struggle over all the fallen trees and through the overgrown area I noticed that after I navigated across the last trail there was an increase in ungulate activity. I decided that when collecting my data for the final research I would randomize the points in an equally large 5 ha area south of this last trail (where there are no intersecting trails) in order to minimize the influence of human activity on the use of the area by deer and elk.

I also encountered some unexpected difficulty in accurately estimating percent cover of vegetation in the circular plotting technique that I decided upon. I tried my best to use the BC Ministry of Forest “Field Manual for Describing Terrestrial Ecosystems” and follow their guidelines for estimating in a circular plot and I will do my best to be consistent, but I imagine that by my last plot of the 30 replicates will be much more accurate than the first.

I found the randomization of points by GPS coordinates to be well suited for this study design, and I found that the AVENZA maps app on my Iphone to be easy to follow and navigate to the GPS point locations (though an external battery bank charger is necessary for extended amounts of time). The only issue was the accuracy, the GPS was only accurate to one decimal place of one second of latitude and longitude which theoretically should result in a 10×8 ft area for me to then have to try to randomize a location where the plot should go, but the GPS was jumping all over the place and I ended up having to estimate. I couldn’t just put it in the closest pile of deer scat or in the middle of a trail, and placing the plot in the middle of a bush wasn’t something that I would consider naturally. So, I decided I had to find the approximate boundaries of the points area and then estimate the middle so that I wouldn’t be biased in choosing a point.

I had intended on creating an inventory of all the shrub species that I found in each plot but quickly realized that there were species present that I couldn’t identify at this stage of the season. I decided to just enter them as other shrubs and not spend an eternity looking for defining physical characteristics.

One unexpected hurdle I did not expect was the compromising of my safety by choosing to navigate alone to GPS points in very thick bush where black bear and cougars have been recently sighted. I am well acquainted with traversing tough terrain from many seasons of tree planting, logging on the coastal mountain sides, and many extended hunting trips into the back country, so I did not really expect to experience some slight fear as I was half stuck in an Alder thicket looking down at fresh black bear prints following fresh fawn prints in the mud. I decided that I would forgo following this bear and possibly dead fawn into the next thicket just to collect my point data, and I would generate another random point instead. I decided to bring my bear bangers and some bells for my bag when I collect all my data so I don’t almost sneak up on a bear and its kill again.

Blog Post 1: Observations

User:  | Open Learning Faculty Member: 


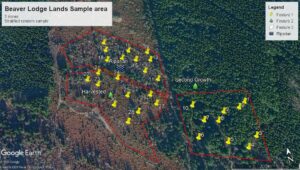
The areas that I selected for my research project are the Community Forest (CCF) and the Wildstone Golf Course (WGC) in Cranbrook, BC (Fig 1). Specifically, I would like to focus on studying the aquatic  communities found in ponds at both locations.

Fig 1: Study area map

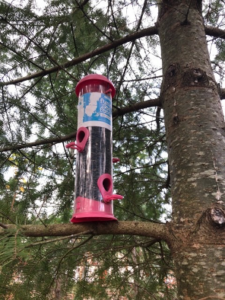
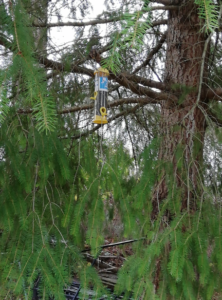
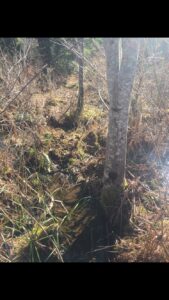
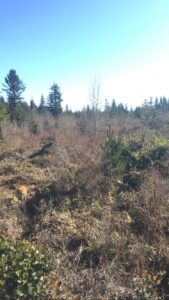
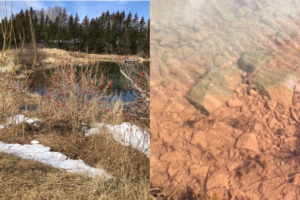
The study area is located within the Southern Interior Mountain Ecoprovince. The landscape is defined by rolling hills with vegetation dominated by dry coniferous forest and grassy understorey characteristic of the Interior Douglas-fir biogeoclimatic zone. The CCF consists of 2000 ha of crown land under provincial protection. The area provides a variety of recreational use opportunities although historical land uses included extensive forest harvesting and waste disposal. The CCF includes a number of groundwater fed lakes and ponds hosting rich and diverse biotic communities. The WGC was built in 2010 approximately 3 km south of the CCF. It covers 105 ha and encompasses 3 artificial ponds fed by groundwater wells and used for irrigation (Fig 2, 3, 4). Two of the ponds have recently been stocked with Rainbow Trout (Oncorhynchus mykiss).

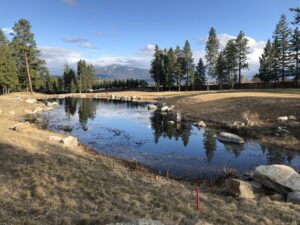
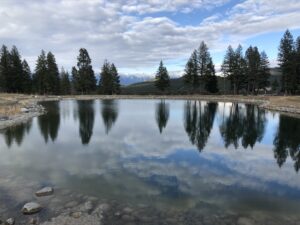
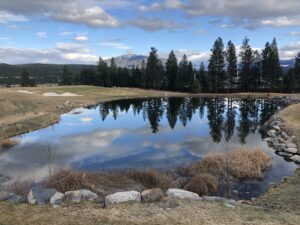
Fig 2, 3, 4: WGC irrigation ponds

Due to their close proximity, the two areas experience very similar geoclimatic conditions. However, the CCF was formed naturally and receives limited anthropogenic pressure while the WGC is man-made and heavily managed (e.g., vegetation cutting, nutrient input, chemical application). This contrast provides an interesting experimental setup within which a number of biological hypothesis could be formulated and tested. For instance, I wonder how the macro-invertebrate communities compare between a natural well-established pond and a 10 years old artificial pond. Is the community composition affected by variations in water chemistry, riparian vegetation, presence/absence of fish?

Answering these questions could have interesting management implications. The golf course groundskeeper is facing costly maintenance issues due to aquatic invertebrates plugging the irrigation system.  The application of toxic chemicals is effective in lowering the abundance of invertebrates but has negative environmental effects. Could the introduction of fish and riparian vegetation result in a shift in the invertebrate community and help address the maintenance issues?

Over the coming weeks, I will continue visiting each area to refine these questions and develop an appropriate experimental design to address them. I will also focus on identifying candidate ponds in the CCF comparable in size, bathymetry, and hydrology to the WGC ponds to control for differences in abiotic parameters that may confound the study. I will also complete a high level assessment of the invertebrate community at each site to select suitable sampling techniques and timing.

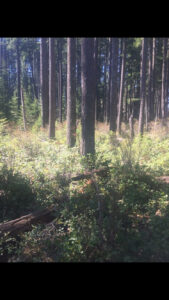
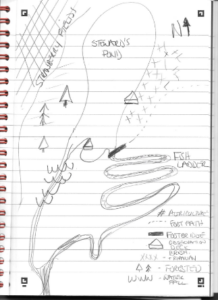
A sites visit at the CCF #6 pond conducted on April 18, 2020 found abundant bird activity. Of particular interest was the presence of Red-winged blackbird (Agelaius phoeniceus), Mountain bluebird (Siala currucoides), Common goldeneye (Bucephala clangula), and an unidentified flycatcher species. These species are known to feed on larvae and adult aquatic invertebrates. The air temperature was 9 degree Celsius with a mix of sun and cloud. The water temperature was approximately 8 degrees. Chironomid pupaes were observed emerging from the water surface and small groups of adults were spotted flying above the water surface. Fish were rising at emerging insects. The riparian vegetation including cattail, bullrushes, and cottonwood was still dormant (Fig 4).

Fig 4: Field notes

Post 3- Ongoing Field Observations

User:  | Open Learning Faculty Member: 


I am planning on studying the relationship between ungulate presence and the abundance of certain vegetation types. There are 3 zones of interest that I will observe: 80 year old Second growth Douglas Fir plantation, Riparian zone, and 18 year old harvested area. When walking through these areas I have noticed an abundance of Cervus canadensis roosevelti  sign in the riparian zone but none in the other areas, whereas I have noticed lots of Odocoileus hemionus columbianus sign in the harvested area but not as much in the forest and riparian zone. I have also observed a higher proportion of Vaccunium parvifolium and Gaultheria shallon in the forest than in either of the other two areas, whereas there is a higher abundance of Alnus rubra and other deciduous trees and shrubs in the riparian zone along with ground cover abundant in grasses. The harvested area is evenly covered in Vaccunium as well, but it seems to be less abundant than in the forest. Most of the ground cover in the harvested area at the moment is dead Pteridium aquilinum, but there are also new conifers as well as sparse large deciduous trees and shrubs.

Hypothesis: Cervus canadensis roosevelti sign is more abundant in areas with higher % cover of grasses and lower in areas with low % cover of grasses.

Prediction: Cervus canadensis roosevelti sign is more abundant in the Riparian zone where there is higher % cover of grasses and lower in the forest and harvested area where there is little to no grass cover.

Predictor variables: Riparian zone, Harvested area, Douglas Fir plantation (Categorical)

Response variables: % cover grasses (continuous), # of Cervus canadensis roosevelti scat groupings(Continuous)

Field Journal- scan0024

Post 9 – Relfection

User:  | Open Learning Faculty Member: 


I found this project to be very difficult.  I think the most difficult part was coming up with a subject to study and a hypothesis.  I made several changes to my research, and actually completely changed my location, hypothesis, sampling method, and pretty much everything after my first attempt at data collection.  Furthermore, it may have been beneficial to go and collect more data, but due to CoVid, the park is now closed.

This research did teach me more about how ecology theory is developed, but I think I actually found the assignments in which I needed to assess others people studies more helpful.  My study itself was too limited, and eventually just got to the point of needing to be finished and out of my life. Regardless, though not necessarily my best work, it was a new experience that will further help me develop my education are career.

Post 1: Observations

User:  | Open Learning Faculty Member: 


Post 1: Observations

The area chosen for this project is a managed nature park approximately 75 m2  that is part of a larger 4,460 ha watershed. Located in Queens County, Prince Edward Island, this is an area of mixed Acadian forest, riparian and agriculture land. There is a small freshwater pond that feeds the Westmoreland River, that eventually leads to the Northumberland Strait. There is a man-made fish ladder and artificial waterfall to help migratory fish species. The elevation is at sea level, with rising elevation of 10 meters to the northeast. The first site visit was April 8th, 2020, on a clear day, with no precipitation, slight wind, and a temperature of 4°C. The area had been completely covered in snow up until 3-5 days prior, with some snow still present.

Live animal sightings and sign included:

  • American Black Duck (Anas rubripes)
  • American Bald Eagle (Haliaeetus leucocephalus)
  • Belted Kingfisher (Megaceryle alcyon)
  • Water Boatman (Garridae, spp)
  • Various passerines
  • Frog sounds-unidentified
  • Unidentified Aquatic Eggs-most likely macroinvertebrate…TBD
  • Signs of mice or vole over-wintering.


Some thoughts on research projects include:

  1. Water quality testing to determine the effect of agriculture on the local ecosystem, particularly amphibians.
  2. Amphibian inventory to determine how their health correlates with the health of the ecosystem
  3. Amphibian inventory to assess which habitat is being used the most and how to best improve that habitat and discourage human interference.

I do know that I want my research to include amphibians, as there is a gap in information on Prince Edward Island about local amphibians, their numbers, and their health. I plan on using a vlog to take temperature readings, but I am not sure how I will use that data. I am hoping to find egg masses that belong to frogs or salamanders, and possibly put the vlog there-maybe I can draw a correlation between water temperature and hatchings.

Figure 1: View from the south facing northwest

Figure 2: Egg masses-ID TBD


Post 8

User:  | Open Learning Faculty Member: 


I created a few graphs, but in general they show how many conifer seedlings were browsed, or not browsed with the presence or absence of red-osier dogwood.  My data was simple, so making graphs was not difficult.  However, I have yet to decide which table and graphs I have made will go into my actual report.  The results did mostly show that conifers were less browsed when red-osier dogwood was present, however, this varied with tree species.  This had led to question of is there is diet selection of conifer species as well as diet selection of shrub vs. conifers for ungulates.  It would appear that they prefer subalpine fir, however, much of literature I have read suggests that ungulates prefer Douglas-fir.

Post 7

User:  | Open Learning Faculty Member: 


The theoretical basis of project is around ungulate winter diet selection of regenerating conifers.  This requires looking at topics around ungulate habitat needs, food selection, land use of ungulates, browse pressure on vegetation, and land manager treatments to avoid browse pressure on confer seedlings.

Key words: Ungulate food selection, ungulate browse pressure, conifer seedling damage