Recent Posts

Blog Post 7: Theoretical Perspectives

User:  | Open Learning Faculty Member: 


Shannon Myles

March 10th


My study investigates the abundance of flowering plants and their distribution pattern through the field. As my field is a part of an ecotone (the transition zone between the sea/sandy beach to the mainland), I hypothesized that a gradient in flower abundance will be surveyed. It is a recurring pattern in nature that a transitional zone between two ecosystems is characterized by a gradient that essentially fades both ecosystems into one another. In my specific case, the marine environment that is the ocean meets a drastic end at the shoreline. Therefore, the mainland ecosystem is the only one that will display this gradient (fading). The underlying processes that might come into play to create this (potential) gradient are of a wide range that includes soil moisture, soil composition, other vegetation and root systems, salt concentrations, etc.


The summarizing keywords for my study could be the following: Ecotone, transitional abundance gradient, flowering plants.

Blog Post 6: Data Collection

User:  | Open Learning Faculty Member: 


Shannon Myles

March 10th


I collected my data on March 10th, during a clear and sunny afternoon. It was a very warm and windy day here in Florida. I made my way to the study site in the morning around 10am and spent an hour or so collecting my data.

In order to thoroughly sample my site, I decided to double the number of samples or transects from my initial data collection in module 3. I then collected the same number of subsamples (or quadrats) per transects (10) but on 10 samples instead of 5. To do so, I had to collect my samples every 8 metres along the width of the field instead of every 16m.

Considering that I had collected my pre-experimental data from module 3 about a month ago, I decided to collect 10 new samples instead of only adding the 5 new ones to my already collected data. I feared that flower abundance might have changed with time and so I resampled everything.

The previous data collection that was made a few weeks ago greatly improved and facilitated my morning of March 10th. The difficulties I had with keeping my transects straight were eliminated by the simple trick I elaborated months ago. Before starting my sampling, I would spot 2 or 3 checkpoints along the transect to keep it straight. I believe this simple adjustment helped me maintain a greater quality of samples.

I did not observe any new patterns during this exercise. The data collected seems fairly similar to the set collected months ago and so my observations and comments were the same.

Blog Post 6 – Data Collection

User:  | Open Learning Faculty Member: 


Blog Post 6 – 16/02/20

Field collection went well today. I went out to collect data at 1700 hours. The skies were clear and the temperature was mild, a few degrees above zero. There was a slight wind and some mild snow cover, but otherwise there were no issues with collecting my data. Today I surveyed the location of the trees within the randomly selected sample locations. The tree sampling went well and there were no issues with implementing the stratified random sampling design. Firstly, I divided the areas into the three strata of pond land, central park land, and edge land. 15 transects were then randomly selected with 5 quadrats per transect. Transect amounts reflected the percentage covered by each strata namely 8 transects for central park land, 4 transects for edge land, and 3 transects for pond land. I then marked each quadrat with an “X” to indicate the presence or absence of each of the three tree species, white spruce (Picea glauca), aspen poplar (Populus tremuloides), and white birch (Betula papyrufera). Upon collecting this data I noticed that there was a surprisingly high amount of white birch trees in the pond land transects, which was unexpected and caused me to reflect upon my hypothesis. I am now wondering if the white birch (B. papyrufera) tree species requires a higher soil moisture level to survive. However, a substantial amount of white birch was also found in the central park and edge land transects, therefore it is possible that the which birch thrives in all soil types. I will do some research on the growing conditions for white birch and use the information to reflect upon my findings. For this data collection I also sampled three replicates from each of the three strata to determine the soil moisture content. As expected, there were higher levels of moisture in pond land soil than anywhere else in the park, while edge land soil had the lowest levels of moisture. In essence, the moisture sampling also went very well despite the light snow cover and overall the data collection went very well today. 

Blog Post 2: Sources of Scientific Information

User:  | Open Learning Faculty Member: 


I chose the paper “Explanations of Intertidal diversity at regional scales” by Mark A. Zacharias and John C. Roff. This is an academic, peer-reviewed research article published in the journal of biogeography. I came to this conclusion after reviewing the paper and seeing that it had a bibliography and in text citations, as well as anonymous referees acknowledged. This paper also contained a methods and results section that details the research done. 

The paper can be read from the link below: 

https://onlinelibrary.wiley.com/doi/abs/10.1046/j.1365-2699.2001.00559.x


Blog Post 1: Observations

User:  | Open Learning Faculty Member: 


The area that I have chosen to study is Mount Tolmie in Saanich, British Columbia. It is a small mountain, about 120 meters in elevation. It has some residential buildings as well as a paved road and public viewpoint and picnic areas. This area is designated as a city park. This area is a diverse home to many plant species, most notably the garry oak and arbutus trees. I visited the area in mid-february, on a sunny morning with light clouds and wind. The mountain has lots of exposed rock and is fairly dry, and has some meadow. 

Some things that I would be interested in studying in this region could be along the gradient of elevation change. For instance, I could study the concentration of certain elements such as nitrogen, phosphorus and potassium in the soil. I could also study the species density of a certain tree or shrub in respect to elevation as well. I may also want to study the diversity of a specific division of plants, such as a moss. Species I could study are the garry oak tree, the arbutus tree, or the division bryophyta.

Feb. 14, 2020 field journal BIOL 3021

Blog Post 9 Reflections

User:  | Open Learning Faculty Member: 


For my research project I counted the abundance of ferns in three different light gradients. The lighting zones were No Shade, Partially Shaded and Shaded all varying in canopy cover. My results did not agree with my original hypothesis that I would find more ferns in the shaded zone. From my research I learned that the fern was likely within its optimal growing conditions under the Partially Shaded Zone. I also researched into why I had almost no ferns in the no shade zone. Originally, I thought it may be the ferns dislike of sunlight; however, from my research I learnt that it was likely a combination of factors. The reasons I think the fern did not grow in the No Shade zone was 1) because the No Shade zones were the consequence of human disturbances; blechnum spicant (deer fern) is known to not respond well to disturbances, 2) the fern was not able to compete with the early pioneers in the disturbed zones. From my research I also found that I my conclusions were limited because I did not know the moisture content of the soil the ferns were growing under, relative humidity and the trees the ferns were often growing around.  The project was still a very positive experience for me. Never the less it was a bumpy ride for me for the following reasons which one would do well to consider in their project:

  • Originally I was studying a fungi that was very hard to find so I had to change to a more manageable organism to count and study.
  • My study area is Barnaby mountain and I had originally chosen sites very high on the mountain which made the process of making observations not only time consuming but very difficult to conduct measurements on a steep incline.
  • I had a really hard time finding relevant scientific articles to review for my paper. This could be avoided by an extra hour of or two of research at the beginning of the project to determine if the organism of interest has much written on it.

Blog Post 7: Theoretical Perspectives

User:  | Open Learning Faculty Member: 


To review, my hypothesis is that trees growing in groups will have a different mortality rate in comparison to those growing in isolation across all aspects of growth. The theoretical basis of my project is that tree density and aspect will effect how successful Douglas-fir trees are. My hypothesis is primarily concerned with aspect of growth and tree density. It might also touch on environmental factors such as precipitation throughfall, competition, and disturbance frequency. My research is underpinned by ideas such as tree-to-tree competition, annual precipitation, and annual hours of sunlight. Some key words that could be used to describe my project are Douglas-fir forest, aspect of growth, and tree density.

Blog Post 5: Design Reflections

User:  | Open Learning Faculty Member: 


Did you have any difficulties in implementing your sampling strategy?
If yes, what were these difficulties?
-Yes, the peatlands where I planned on gathering data were either flooded, or snowed over, making finding either Scotch heather or cranberry plants a challenge. The conditions have improved, however, and I returned last weekend to begin collecting data, again.

Was the data that you collected surprising in any way?
-Not really, however, I only collected one quadrats worth of data. I collected data from within the burn zone. The quadrat only contained Scotch heather (Calluna vulgaris), and it was present with 75% of the cells within a 1m^2 quadrat with 10cm^2 cells.

Do you plan to continue to collect data using the same technique, or do you need to modify your approach? If you will modify your approach, explain briefly how you think your modification will improve your research.
-My basic method of gathering data using the above mentioned quadrat will not change. However, I may change the strings in the quadrat for wires.

Also, after studying experimental design for a few weeks this semester at my own university, I have decided to make some changes to how I will design this study. I have laid my observational study as follows:

The general design format will stratified random sampling, and the the statistical analysis I will use will be based on this design. I will use Jamovi for the analysis.

The burnt area of the bog in the DND lands will constitute one sampling strata, and the unburned area around it, delineated by a square boundary, will constitute the other sampling strata. Each strata contains 10 samples, selected randomly by drawing lots (separately and independently for each strata).

After I drew these lots for each strata, I used a web application (Earthstar GeoInformatics) to figure out where these samples would be found using longitude and latitude. I generated the map shown below:
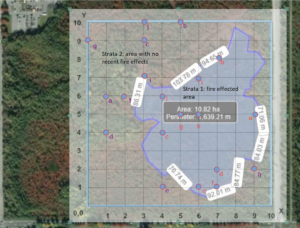
Here are the coordinates for the sample locations, and notes on how I calculated their positions:

Strata 1:

a latitude 49.17356 N longitude 123.10890 W
b 49.17538 123.10638
c 49.17493 123.10764
d 49.17265 123.10890
e 49.17129 123.10700
f 49.17356 123.10827
g 49.17493 123.10954
h 49.17175 123.10385
i 49.17402 123.10764
j 49.17538 123.10764

Strata 2:

a 49.17311 123.10385
b 49.17447 123.10512
c 49.17265 123.10701
d 49.17175 123.10511
e 49.17129 123.10574
f 49.17129 123.10511
g 49.17311 123.10638
h 49.17311 123.10575
i 49.17357 123.10512
j 49.17356 123.10701

I will use my smart phone to find each sample location.

Null hypothesis: there is no correlation between the effects of bog fire, and the presence of Calluna vulgaris and Vaccinium oxycoccos within the DND lands bog.

Alternate hypothesis: there is a correlation between the effects of bog fire and the differences in presence of C. vulgaris and V. oxycoccos, if any such difference can be observed, within the DND lands bog.

The statistical analysis I will use is summarized on this Oregon State University website. I will also be do an analysis to test for correlation between percent presence of both Calluna vulgaris, and Vaccinium oxycoccos within the burnt and unburnt strata. The presence of either species is measured by species present or not present in each cell within the quadrat, each quadrat having 100 x 10cm^2 cells.  If a species is present within the cell, this is simply considered a tally of one, for presence within cell. Both heather and cranberry could potentially be counted as present in the same cell, or they could not.

However, I’m not sure yet if Jamovi can already do this, so after doing more data collection tomorrow, I will be exploring what options that software has, and if it doesn’t, I’ll have to decided to either create a module myself, and to simply work through the mathematics myself. I should have a large chunk of my data for strata 1 collected before the weekend, and hopefully have Jamovi figured out by the end of this coming weekend.

Regardless of what modules Jamovi currently has, the sampling design I will use is what I just described, and the analysis will follow the Oregon State web page as my outline for analysis. I’ll go over this in greater detail in a future post.

Blog Post 5 – Design Reflections

User:  | Open Learning Faculty Member: 


Blog Post 5 – 12-02-20

Collecting the initial data in Module 3 proved to be a difficult task. I spent much time trying to ensure that I correctly identified the vegetation species in the current winter conditions. The species I selected were large enough for me to clearly identify what grouping they belonged to and once that task was complete I was able to get a closer look at them to determine what species of tree or bush they were. The sampling strategy I chose for that data collection was Stratified Random sampling. The study area of the park was divided by strata into park land, which the area was mostly comprised of, and pond land, which was a much smaller portion. After diving the two strata, I randomly selected four areas in the park land and sampled the vegetation within, finding this process to be rather difficult for the aforementioned reasons. The two pond areas were relatively easy to measure, especially as I drew closer to the water with much of the regular vegetation diminishing in these areas. The data that I collected seemed to be relatively unsurprising with some of my general expectations having been met. For example, I had made the prediction before sampling that vegetation such as the Broadleaf Cattail (Typha latfolia) would be found only in pond location quatrats. Upon sampling, it was made clear that this prediction was correct. Overall there were no unusual data collected that caused me any surprise. I think from completing this first sampling data collection, I will continue to use the same strategy of Stratified Random sampling as it appeared that this strategy allowed me to accurately find both the abundance and distribution of several species in the park.

Blog Post 4 – Sampling Strategies

User:  | Open Learning Faculty Member: 


Blog Post 4 – 03-02-20

Out of the three sampling techniques, Random Sampling was the most efficient in terms of time with the sampling taking a time of 12 hours and 4 minutes. Haphazard Sampling was the second most efficient technique in terms of time with the sampling taking 12 hours and 32 minutes and Systematic Sampling was the least efficient in terms of time with the sampling taking 12 hours and 44 minutes to complete. For the Eastern Hemlock Systematic data, the percent error for the density was 9.959% while for the Random data the percent error was 18.813% and for the Haphazard data the percent error was 6.895%. For the Sweet Birch Systematic data, the percent error for the density was 18.468% while for the Random data set, the percent error was 4.255% and for the Haphazard data the percent error was 24.085%. For the Yellow Birch Systematic data, the percent error for the density was 27.273% while for the Random data the percent error was 19.651% and for the Haphazard data the percent error was 31.129%.  For the Chestnut Oak Systematic data, the percent error for density was 9.456% while for the Random data the percent error was 23.771% and for the Haphazard data the percent error was 19.086%. For the Red Maple Systematic data, the percent error for density was 8.915% while for the Random data the percent error was 36.922% and for the Haphazard data the percent error was 19.176%. For the Striped Maple Systematic data, the percent error for density was 28.571% while for the Random data the percent error was 76.0% and for the Haphazard data the percent error was 114.285%. For the White Pine Systematic data, the percent error for density was 10.0% while for the Random data the percent error was 10.0% and for the Haphazard data the percent error was 50.0%. Based off of these calculated values, the most accurate sampling strategy for common species (the most common being the Eastern Hemlock) was Haphazard sampling, followed by Systematic sampling. In comparing the two most common species, Haphazard sampling an Systematic sampling were very close in terms of accuracy, while Random sampling was not close. Based off of the aforementioned calculated values, the most accurate sampling strategy for rare species (the most rare being the White Pine) was very clearly Systematic sampling. The accuracy generally declined for rare species, especially in the Haphazard sampling data. This suggested that as species abundance lowered, accuracy in density measurements also lowered. Having 24 sample points perhaps was not sufficient to measure the number of species in the area. Perhaps 24 sample points was enough to provide an accurate measure of the common trees species, but it was not enough to provide an accurate measure for the number of rare tree species in the area; however, 24 sample points appeared to be enough to capture the relative abundance of each of the tree species in the area.