Recent Posts

Blog Post 5: Design Reflections

User:  | Open Learning Faculty Member: 


Shannon Myles

February 3rd, 2020


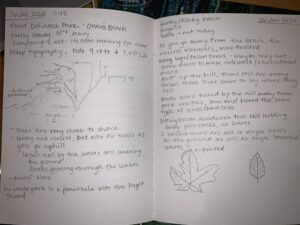
During my data collection in the field, the systematic sampling strategy proved to be efficient at surveying the area. The few difficulties I encountered during the sampling did not damage the quality of my data in any way. First, the determination of transects was simple, but keeping that transect straight as I collected my subsamples across the field seemed to be a challenge. For the last three transects, I established three or four checkpoints along each transects in order to keep me straight. Having closer targets greatly improved the quality of my transects. Secondly, making my way along a transect turned out to be slightly more challenging than I expected. The vegetation got pretty dense in some portions of the field. I always managed to make my way through it but I had to push through some plants and small shrubs. Applying the quadrat down never was an issue. I would simply drop it over the vegetation of the area, however tall or dense that was.

The data was not surprising to me. These first samples even seem to play in favour of my initial hypothesis – more flowers appeared as I sampled away from the beach. One noticeable aspect of my data was that all types of flowers seemed to be displayed in clusters.

I think that my systematic approach to survey the site was the best option. The data collection was performed with minimal difficulties that were all overcame to maintain the essence of the systematic method. It eliminates the possibility of bias, and more samples will only add to the reliability of my data.

Blog Post 3: Ongoing Field Observation

User:  | Open Learning Faculty Member: 


Shannon Myles

February 3rd, 2020


By comparing the observations made on the field to the online plant database of the University of Texas (website: https://www.wildflower.org/), I was able to identify the four flowering plants of the site as the following: 

  1. Crotalaria Juncea L. or Sun hemp, the twolobed yellow flowers. 
  2. Helianthus debilis or Beach sunflower, the flowers with yellow petals and a black or yellow center of stamens.  
  3. Hepatica nobilis var. acuta sharp-lobed hepatica, the small white flowers with three-lobed green leaves. 
  4. Richardia brasiliensis small 6 petal purple flowers. They have long pointy green leaves. 

During my observations on the field, the concept of ecotone or transitional zone is what really hit me first. The abundance of flowers seemed to be proportional to the distance a certain patch of grass was from the beach. In other words, it seemed like the farther away I walked from the beach, the more flowers were scattered on the ground around me. It also seemed like the two types of yellow flowers were much less abundant all throughout the field. Though surprisingly, those bigger flowers appeared much closer to the beach than the majority of the smaller white or purple flowers.  

My hypothesis for this study will be that the natural step-cline creates a gradient in flower abundance that increases proportionally to its distance from the beachThe effect of the natural step-cline that is the beach, in this case, could be on nutrients in the soil or dryness of the soil. As observed, the soil in the area is very sandy, which is probably a result of its proximity to the beach. Very sandy and dry soil cannot support much plant life. Hence why the beach is one of the only places in the world where grass can not grow. So, my prediction for this research is that more flowers will appear as I walk away from the beach with my quadrat. No flowers should be observed in the first few meters from the beach as the soil will still be too dry and sandy. But, as I move towards the mainland, I predict that a few flowers will first appear and that abundance will increase after.  

The hypothesis I will test will be evaluated by the effect of the predictor variable (the distance of the quadrat from the beach) on the response variable (the abundance or number of flowers in the quadrat). By repeatedly gathering data on those two variables along the gradient, I’m hoping I will discover a trend in abundance variation. Considering that both the response and predictor variables will be continuous data, a regression design study will be used. 

Field Notes Blog Post 3

Blog Post 2: Sources of Scientific Information

User:  | Open Learning Faculty Member: 


a) One of the sources that I am going to use is Petersons Field Guide to Western Birds


b) This peer-reviewed academic material, as Roger Peterson is a distinguished academic and an expert in his field.

  • The book includes in text citations.
  • Includes a bibliography (although in the introduction of the book instead of the appendix)
  • Peter Alden et al, reviewed the text

Has the characteristic of being written by an expert in the field- Roger Peterson is one of the world most celebrated naturalists. His first field guide as published at the age of 23 and has received more than two dozen honorary degrees, as well as the presidential medal of freedom.

Peterson, R., DiGiorgio, M., & Peterson, R. Peterson field guide to birds of Western North America. Boston: Houghton Mifflin Company.

Blog Post 4: Sampling Strategies

User:  | Open Learning Faculty Member: 


Shannon Myles

February 1st, 2020


I used the distance-based sampling methods to measure tree species abundance in the tutorial. Table 1 below illustrates the data gathered.

Table 1 Comparison of three distance-based sampling methods used to calculate the abundance of tree species in the Snyder-Middleswarth Natural Area. 

Tree Species  Actual  Systematic  % error  Random  % error  Haphazard  % error 
Eastern Hemlock  469.9  277.3  40.99  441.8  5.98  485.0  3.21 
Sweet Birch  117.5  109.6  6.72  144.1  22.64  121.2  3.15 
Yellow Birch  108.9  70.9  34.89  105.6  3.03  83.9  22.96 
Chestnut Oak  87.5  38.7  55.77  115.2  31.66  93.3  6.63 
Red Maple  118.9  90.3  24.05  86.4  27.33  74.6  37.26 
Striped Maple  17.5  45.1  157.71  28.8  64.57  18.7  6.86 
White Pine  8.4  12.9  53.57  0.0  100  18.7  122.62 
Estimated time to sample  4h 18min  53.39  4h 40min   36.46  4h 38min   28.96 


Table 1 shows that the estimated times to perform the studies were somewhat similar, but that the fastest method to sample 24 plots was the systematic approach by approximately 20 minutes.

The comparison of measurements of abundance showed that the most precise technique for the most abundant species of tree (Eastern Hemlock) was the haphazard technique. With a % error of only 3.21, it surpasses the random sampling method in accuracy by less than 3%. Both the random and haphazard techniques were far more accurate than the systematic method, which led to a terrible % error of 40.99%. As for the second most abundant species of tree in the area (Red Maple), the best sampling method was systematic, with a % error of 24.05.

For the rarest species of tree (White Pine), the most accurate sampling method was found to be the systematic approach. With a relatively high 53.57% error, it is far more accurate than the two other methods, who have both surpassed 100% error. The abundance of the second least abundant tree (Striped Maple) was very accurately measured by the haphazard method. It scored a 6.86% error, comparatively to 64.57% and 157.71% for random and systematic.

Generally speaking, the accuracy of all three methods seemed to have diminished as species abundance became lower. Except for a few odd data points, the majority of % error was inversely proportional to the actual species abundance, no matter the sampling strategy.

Finally, the average % error of the haphazard method (28.96%) was lower than for random and systematic methods (36.46% and 53.39%). Therefore, I conclude that the distance-based haphazard method is the most accurate for sampling abundance in a forest.

Blog Five: Design reflections

User:  | Open Learning Faculty Member: 


Blog Five: Design Reflections by E. C. Bell 

My hypothesis-in-the-works has shifted towards considering the soil with the highest degree of salt to have the least amount of vegetative diversity. As a result, my sample unit has become the soil in relation to flora species and visible attributes. I maintained random selection of sample replicates by tossing my spade towards a first sample site and then used a tape measure (predetermined distance) and a compass to sample the next four sites. For each sample site in the two gradients being compared, I placed the quadrat (0.5m x 0.5m) so that the spade was in the center and in a manner that allowed for the stems of the species of vegetation present, gently discouraging vegetation that was “leaning in”.  

The soil samples were taken from surface to a depth of fifteen centimeters. Five samples were taken from the western (open ocean) plot and five from the eastern (inlet exposure) plot. The matrix of the soil samples was as I expected, the open ocean samples being mostly sand and the inlet samples being mostly humus. At home I baked each sample in the oven at 200 degrees Celsius for four hours. I used a 1:2, soil to distilled water, to create a slurry, then followed the same procedure for testing the concentration of total dissolved solids for each of the ten samples.  

Because both regions being sampled had very little differentiation, there was no need to create subareas, therefore I did not use the stratified random sample method. Instead, I used a systematic sampling method to transect the sample region, the sample sites spaced in proportion to representation of the gradient, a method that if replicated would yield samples that were also indicative of the region. The data I have collected has demonstrated completely opposite results from the position of my hypothesis. In the name of science, I will not change anything but I will explore why this is so in the discussion portion of my study.

Carmen Bell

Blog Post #1: Observations

User:  | Open Learning Faculty Member: 


The area chosen for study is called Point Defiance Park in Tacoma, Washington, US. The park sits on a peninsula that is surrounded by the Puget Sound: Dalco Passage on the east and the Narrows on the west, and it is about 760 acres. Point Defiance Park is mostly forested with tall fir trees, besides the zoo and aquarium that sits on its lands. The perimeter along the Puget Sound is comprised of steep hills or bluffs down to the water.

I observed Point Defiance Park at 11:45 on the 26th of January, at which time the tide was at 9.10ft/2.77m and going down.  At that time there was approximately 20 yards from the water’s edge to the incline of the hill.  It was 50 degrees (F) and mostly cloudy, though it has been raining consistently in the area for almost one month, very typical for this season, but warmer than usual.

There seemed to be many logs that had accumulated, (but didn’t look like driftwood) between the beach and the sidewalk that has been paved alongside it. On the other side of the sidewalk, trees grow very close to the water: it seems that deciduous trees grow right along the shoreline, and just beyond that and as altitude increases, the presence of coniferous trees increases, as well as the density of the forest.  The park seems mostly un-interfered with: I found many fallen trees as I went through the forest, and the further I got from the sidewalk, the trails of prior park visitors faded. Some of the fallen trees had mushrooms growing on them as well. On the ground below the deciduous trees were leaves mostly of two types, corresponding to two types of trees along the shore. They had not decomposed yet, and grass has started to grow through the layer of leaves. There were ferns all over, but none yet showing new growth. I heard many birds with the same call, but did not get a good enough look to identify them, as well as many glaucous gulls. I did not see but heard other park patrons report seeing great blue herons further down the beach.

Three questions I have:

  1. Does the diversity of birds increase as you go further away from high-traffic areas of the park?
  2. Is the pattern of deciduous trees close to the water and coniferous further from the water consistent around the peninsula?
  3. At times of low tide is there a greater presence of gulls or other birds?


Field notes 1

Blog Post 1: Observation

User:  | Open Learning Faculty Member: 


Shannon Myles

January 30th, 2020


The study area chosen is a strip of grassland in Satellite Beach, Florida that separates the beach from the highway. The area covers a rectangle of about 250m alongside the beach and of about 90-100m deep towards the road. The land is flat from the road all to where the terrain abruptly drops 3-4 feet onto the beginning of the beach and eventually into the ocean.

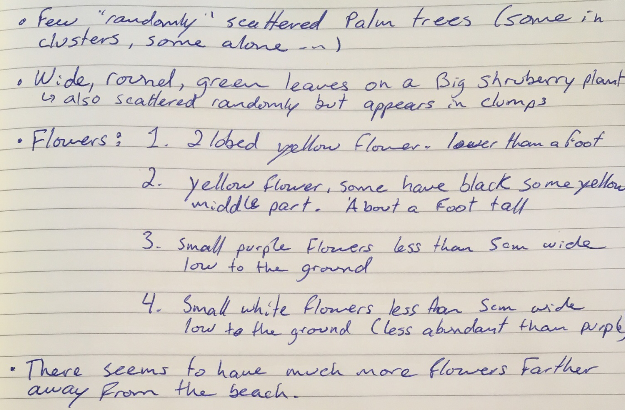
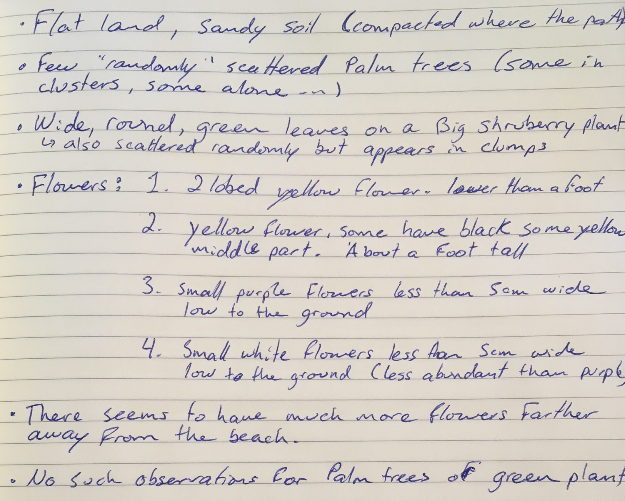
The vegetation in the area seems to be poorly diverse with only a few different grass types, flowering plants and palm trees. The palm trees are scattered in what seems to be a random pattern throughout the area. The site also has Sea Grapes, a type of shrub with large round green leaves. As for the flowering plants, four different varieties were observed in the field. Two yellow flower kinds, one very small white flower, and another small purple flower kind were seen at the site.

The area seems to have been left unshaped by man except for this one clear path of about a car’s width that goes from the road to the beach. The path is characterized by not having any vegetation other than short, scattered patches of grass. The soil seems to be very compact in the area, which leads me to believe that the path is used a lot or by heavy machines.

I visited the site around 12:30 on a sunny Wednesday. As the pictures show, a few clouds were in the sky. The temperature was 15C° and felt cold because of the wind coming from the ocean.

What interests me a lot about this site is the possibility to study the gradient formed by the step-cline created by the ocean meeting the land and its effect on the abundance or physiology of organisms. Some of the questions I had while walking through the area were the following:

  1. How does the abundance of flowering plants vary in relation to the distance with the ocean in the ecotone?
  2. Is the width of Sea Grape leaves affected by its proximity to the step-cline?
  3. Is there a correlation between the height of the palm trees in the area and their distance from the beach?

Field notes 1      Field site sketch

Post 1: Observations

User:  | Open Learning Faculty Member: 


The area that I chose is a portion of the Millstone River, located in the East Wellington area of Nanaimo, Vancouver Island. This portion of the river cuts through a part of Nanaimo’s designated farmland. Several small scale vegetable and feed crops are along this subdued portion of the river, as well as housing developments. The areas around the Millstone river is cleared of the forest canopy, but small forested buffer zones do exist along the course of the river. Historical mining existed within the area in the early 1900s, and mine workings exist below portions of the landscape. It is unknown if these factors influenced the river through its history, but contamination of well water in East Wellington is of concern.

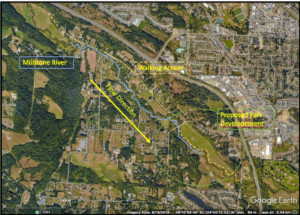
A proposal has gone through Nanaimo’s City Council to designate the area highlighted green in figure 1 as a Wetland Park.  Because of the reasonably shallow gradient of the landscape, the river tends to meander and create flooding within the park when the river is high, which attracts birds and other biota.

I visited the field site on January 26th at 2:30 PM. The landscape is almost clear of snow and we have received rainfall the past several days. Overall, Nanaimo has seen large amounts of precipitation this January, and the river levels are incredibly high.

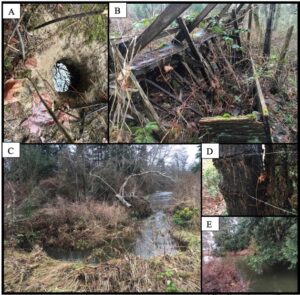
I accessed the river along the proposed park path and noticed that the large field in the park was partly flooded due to high river water. Walking down to the river, I saw that the river banks were nearly breaching, and large scale erosion was occurring along meanders (picture C). I could tell that at one point, agriculture had happened due to remnant barbed wire cutting through mature Douglas fir trees (picture D). Cow feed stalls in an advanced stage of decay were recognized, which could allude to the type of small scale farming that occurred. Invasive species that include English Holly, Himalayan Blackberry, and Scotch Broom are observed along the course of the river. Native species include numerous shrubs in hibernation, mature Douglas Firs, Maples, and alders. A possible beaver tunnel was the only signs of mammals at the site.

Some questions that I thought to myself as I was walking along the Millstone River included:

  1. How much has this landscape changed since humans began to influence it? 
  2. What positive effects will occur when the park expansion is completed, and could cyclical floods inhibit expansion?
  3. What does this unique niche bring to Nanaimo, and why is it worth protecting if the landscape is partly flooded for parts of the year?  

Post 6: Data Collection

User:  | Open Learning Faculty Member: 


I have collected 30 replicates divided evenly among three transects approximately 100 meters in length. The transects were selected using systemic sampling consisting of one for each direction; north, south, east, and west. The replicates were selected using random sampling by using a stop watch to randomly produce a number to determine how many steps to take to find my next replicate. Each replicate was evaluated for trunk diameter at chest height and aspect of growth. Collecting sample data has been difficult as of late due to inclement weather including deep snow and extreme cold. A pattern noted in my data is that Douglas fir trees found on an eastern aspect had the smallest average trunk circumference, followed by trees on a northern aspect, trees on a southern aspect, and trees on a western aspect with the greatest average trunk circumference. In the context of my hypothesis, this data has caused me to reflect on my prediction that trees growing on a northern aspect will have a larger average trunk circumference.

Blog Post 2: Sources of Scientific Information

User:  | Open Learning Faculty Member: 


The source I will examine is my field guide to wild North American mushrooms.

Miller O. K., & Miller H. H. (2006) A Falcon Guide: North American Mushrooms –  A Field Guide to Edible and Inedible Fungi. Kearney, NE: Morris Book Publishing LLC.

It is classified as “peer- reviewed academic review material.”

This is because

a) Dr. Orson K. Miller Jr. is an expert in the field

Dr. Orson Miller is a Professor Emeritus of Botany and Curator of Fungi from Virginia Tech, written 150 scientific papers, discovered and authored 1o5 new species and genera new to science, was president of the Mycology Society of America and has received many prestigious awards in the field (Miller & Miller,

b) in-text citations are present

c) a bibliography is present

d) the publication was reviewed by at least one referee, including Dr. Cathy Cripps, Dr. Walter Sundberg, Dr. Steve Stephenson and Marilyn Shaw

e) there is no field or lab study present, meaning this is review material