Recent Posts

Blog Post 2: Sources of scientific information

User:  | Open Learning Faculty Member: 


Shannon Myles

January 22nd, 2020


A) The source of ecological information that was used is an article published in the scientific journal Aquatic Ecology. The journal publishes various peer-reviewed papers in the field of ecology in all types of aquatic environments. The Aquatic Ecology journal has been running since 1968 and has published 52 volumes since. Its publisher, Springer Netherlands describes the journal has “a multidisciplinary journal relating to processes and structures at different organizational levels.”

The specific journal article that was chosen for the assignment was: “The use of historical environmental monitoring data to test predictions on cross-scale ecological responses to alterations in river flows” (Collof et al. 2018). A paper that looked at data previously collected by hundreds of previous studies in the area to achieve a conclusion. By using the data already at hand, the scientists evaluated the impact of river flow modification to the ecosystem.

Citation: Colloff, M.J., Overton, I.C., Henderson, B.L. et al. Aquat Ecol (2018) 52: 133. https://doi-org.ezproxy.tru.ca/10.1007/s10452-018-9650-y

Link: https://link-springer-com.ezproxy.tru.ca/article/10.1007/s10452-018-9650-y


B) The paper is an academic, peer-reviewed research article.


C) The academic basis of Collof’s paper is obvious as he and all of his co-writers are experts in the field. A list of everyone that worked on the paper’s affiliations is available. Per example, the author, Matthew J. Collof is a member of the Fenner School of Environment and Society, Australian National University and CSIRO Land and Water in Canberra Australia. A list of all the in-text citations is provided in the references section of the article. All the references are themselves, academic papers. The Acknowledgments section of the research mentions that the paper has been reviewed by an anonymous reviewer. The citation goes like such: “We thank […] and an anonymous reviewer for their practical and constructive reviews of the manuscript.” (Collof et al. 2018). Finally, what distinguishes this paper research article from a review material is its precise methods and results. The paper describes how it proceeded to gather information on its subject and then shows the exact results collected. Even if the study used previously collected data from previous studies, it had a goal different than any of those researches. Collof and his team used specific methods that are outlined in the paper to evaluate their own research question based on data scientifically gathered.
Blog Post #9 – Field Research Reflections

User:  | Open Learning Faculty Member: 


Going from set studies to do to a study that anything could be research was much more difficult that I expected it to be. I didn’t quite enjoy having almost no direction at the beginning, but it got easier and more clear the further along I went. There probably are changes that should have been made if I were to do this study again, but due to time constrictions, there wasn’t much movement I could do with it. But I did enjoy some parts, mostly going out to view nature, even if its a man made park, to simple watch it, as well as take my dogs out.

Blog Post 1: Observations

User:  | Open Learning Faculty Member: 


20-01-2020, 1300hrs-1600hrs.

Wakamow Valley, Moose Jaw, SK

Mid Winter, sunny day, -3degrees C

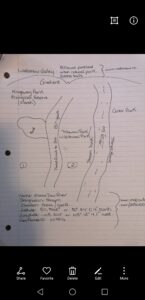
The area that I am going to study is Wakamow Valley in Moose Jaw, SK, my hometown. It is an urban park situated on Treaty 4 land, with 20kms of trails, and 500 acres of land (www.wakamow.ca). Within the valley runs the Moose Jaw River, at approximately 506m elevation (www.mapcarta.com/24501910). The area of Wakamow Valley that I will concentrate on includes Kingsway Park Ecological Reserve, Conor Park camping and recreation area, and Tatawaw Park (old Wild Animal Park) on the southern most edge of the park. There are four distinct ecological zones within just Kingsway Park: woodland, grassland, valley walls, and marsh. Conor Park and Tatawaw Park have been largely altered by tourism but both contain woodland, grassland and valley walls as well. At this time, it is mid-winter in the park, and I am finally able to do some research after a long haul of around -35 degrees C. There has been a mild amount of snowfall, and the park is easily accessible at this time.

Things I thought about on my hike through:

The road that cuts through the ecological zone and stream bed to access Tatawaw Park has been there for 80+ years. Some of the same marsh vegetation can be observed on both sides of the road but I wonder if there are distinct species that are present on only one side of the road now.

Do berries degrade differently naturally? Different colours of berry exist on the same branch but are both obviously rotten in the winter. Is this a normal differentiation or is it caused by disease/mold/etc.? Can it be observed everywhere in Wakamow or is it contained to the marsh area?

Does thorn length and distribution vary among berry bush populations based on location/sun/proximity to water/stream? Those closest to the river seemed to have significantly more thorns compared to those in marsh areas. Is it the exact same species or very similar but different species? Is it a product of age?

Distribution of berries: why is the marsh covered in berry bushes while stream-side it was hard to find any?

Distribution of mushrooms/fungus on trees: Majority of visible fungi found on trees east valley walls and marsh area while only two sightings on trees by stream bed. What affect does heat, shade, wind shelter have on distribution of fungi/mushrooms?


It is very difficult to find things to study in the dead of winter but will continue the search for something concrete to continue with.

Blog Post 5: Design Reflections

User:  | Open Learning Faculty Member: 


Did I have any difficulties implementing my sampling strategy? Yes!

  • I manufactured a simple 1mx1m frame from cardboard in order to accurately find my quadrats. I will say that a cardboard frame is not the best piece of equipment when its a rainy, gusty day at the beach…
  • The tide was all the way in when I visited the site, which made access to the lowest gradient quite difficult at times.
  • I found access to one of my gradients (the slope with boulders) to be more of a problem than I expected. It was physically difficult to reach the quadrats I was to sample in this area, and I had to resort to looking from a distance which was difficult at times due to the blackberry, snowberry, and other plant material in the same area.

Was the data I found surprising? Yes.

  • Yes, only in that I did actually find a single juvenile Alnus rubra when I expected to find none.

Do I need to modify my approach? Yes.

  • Once I put my sampling method in action it become clear to me that it’s not as accurate as I want or that it needs to be. I could not use the 1mx1m frame at every quadrat like I planned. I can’t use the frame for the accessible quadrats and then alter my strategy by eyeballing a 1mx1m quadrat for the inaccessible ones.
  • I need to review different sampling methods, particularly options of sampling from a distance.
  • Finding the single juvenile Alnus rubra brought more variables to mind such as; how exactly am I defining what a juvenile Alnus rubra is and do I need to factor in the harsh exposed conditions that may slow their growth so significantly that what looks juvenile is actually much older?, could the red alder I find be from seed washed up from somewhere else?, how can I 100% determine if alders near a mature specimen are not vegetative growth?

How will modifying my strategy improve the research?

  • Clearly identifying what a true individual alder with defined juvenile characteristics is will reduce the chance of misleading or recording false data.
  • If I can find another sampling strategy that I can do from a distance with a monocular (once the tide is out!)I can have access to more shoreline and therefore more sample plots and improve the accuracy of my data.

Blog Post 2: Sources of Scientific Information

User:  | Open Learning Faculty Member: 


a) The source that I have chosen is an article entitled: Progress in wetland restoration ecology. https://www.cell.com/trends/ecology-evolution/fulltext/S0169-5347(00)01959-5?_returnURL=https%3A%2F%2Flinkinghub.elsevier.com%2Fretrieve%2Fpii%2FS0169534700019595%3Fshowall%3Dtrue

b) This is a peer-reviewed academic review paper.

c) This is a review paper, as it does not contain a methods and results section like a research paper would, but it contains citations, a bibliography (see link for the paper), has been written by an expert in the field (Joy Zedler, and American ecologist) and has been reviewed by at least one referee before it was published (as Cell is a peer-reviewed scientific journal: https://www.cell.com/peer-review).

Blog Post 1- Observations

User:  | Open Learning Faculty Member: 


I have selected  to make observations at the Don Edwards San Francisco Bay National Wildlife Refuge in San Jose, California. It is a 30,000-acre wildlife refuge that sits on the southern end of the San Francisco Bay, and is an oasis for millions of migratory birds and endangered species. About 37% of the refuge consists of salt marsh, brackish marsh and freshwater marsh. The rest of the refuge is mainly made up of ponds and mudflat, which houses plenty of shorebirds, fish and zooplankton. Specifically, I chose to make observations at one of the pond areas of  the refuge, which was made up of shallow, brackish (or maybe fresh) water and a muddy, grassy shore. I visited this sight at 4:15pm on January 16, 2020. When making observations, it was 12 degrees celsius and cloudy outside, with some sunshine peaking through the cloudy sky. Based on my observations, these are three questions that I find interesting.

  1. I observed a group of nearly 100 American Avocets standing and resting in a group, with each individual in very close proximity, in the shallow water of the pond. I wonder if they rest in close proximity to maintain their body temperatures, avoid predation or for another reason?
  2. I observed Black-necked Stilts and American Avocets (both are shorebirds) in the pond, near the shore. I wonder how different regions of the pond or perhaps, different ponds of the refuge with varying environmental characteristics (plants, buildings etc) effect shorebird species richness?
  3. I wonder if shorebirds (or one of these particular shorebird species) prefer to forage close to the shore or at increased depths, further out into the water.                                       

Blog Post 7

User:  | Open Learning Faculty Member: 


My project is around fern growth in relation to varying amounts of sunlight. I have broken the areas I am sampling in to either be shaded, partially shaded or no shade. My hypothesis is that ferns will be more abundant in shaded areas. This is something that I have observed while finding suitable sites for sampling. From my initial sampling the partially shaded areas have the most ferns. Likely there are several other variables influencing the growth of ferns. The amount of water, human disturbances, intraspecific competition, change in gradient which can influence water. The human disturbances occur from one of my sites which is cut every several month by the gas pipeline owners. In this one sites there are almost no ferns possible because they can’t compete with the faster growing prickle bushes and grasses. I plan on taking more samples to provide a more clear picture as to what lighting conditions are optimal.


Keywords: Fern abundance, light adaption, light gradient.

Blog post 9

User:  | Open Learning Faculty Member: 


There were several difficulties during the field research, especially when designing the field experiment and carrying it out.

First, in the step of designing field experiment I had difficulties in deciding response variable that represents what it was meant from hypothesis. The hypothesis is that overall ecology are healthier and varies in species as more artificial land development induced in the region. Independent variable was 3 levels of landscape that differs in land development. While response variable was hard to decide because it needed to represent the vegetation was healthier. At first I thought of measuring the ratio of green grass and dry grass would represent the health of vegetation, ecology. However, I didn’t put in the consideration that three landscapes had way more species other than grass. So, I decided to count the number of species that can be counted within in the quadrat also, I decided to count the green area per quadrat to represent the health of ecology. I also didn’t want to measure merely vegetations so I decided to measure bird activities as well. All three experiments later wards represented the intention of the experiment well.

Also, in the step of implementing the experiment I had issues in choosing sampling techniques. As the landscape were very small quadrat was easily overlapped when I was using random sampling techniques. This might lead the data to be inaccurate. Therefore, I decided to change the sampling technique to systematic. This helped getting more accurate data and observations.

Although my research project was limited in small region and there was not enough samples to support the hypothesis. I realized that practicing an research study, especially on ecology, would be way much more harder than I expected. It was hard to design an appropriate experiment that supports the theme and whether it represents well. Also in the process of carrying out getting the data from the field required a lots of commitment. Due to this project, I had a good time to appreciate of how ecological theory had developed.

Blog post 8

User:  | Open Learning Faculty Member: 


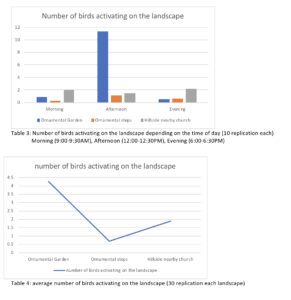
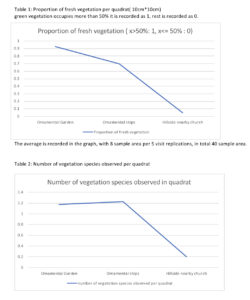
I have made 4 graphs in total to represent my observation for my research project. Graph 1 describes proportion of fresh vegetation per quadrat. The outcome turned out as I expected, the area that had least human management had the least healthy vegetation. While, the area that had most human management had the most healthy vegetation. Graph 2 describes the number of vegetation species found per quadrat. I assumed that there will be the most vegetation species on ornamental gardens and least on the preserved hill and the graph result showed somewhat different results. Ornamental steps had the most various vegetation species per quadrats compared to ornamental gardens yet preserved hill had the least various vegetation species growing in the landscape. Graph 3 describes the number of birds activating on the landscape depending on the time of day (10 replication each). This table demonstrated the bird activities depending on the landscape and time of the day. It was difficult for me to see overall trends of bird activity because the results were showing in so much detail in Graph 3. Therefore with the same data I made graph 4 to represent overall bird activity rate depending on landscape to observe easily. The activity of birds data revealed that did not expect when I started the experiment. I assumed that as ornamental garden had most healthiest vegetation, there would be the most bird activity among the landscape no matter what time in the day. However the results turned out that in the morning and evening the hillside church has the highest bird activities and the ornamental steps were the lowest all the time. This result lead me to a thought that bird activity might not be affected by healthiness of vegetation, instead it might depend on type of vegetations. Further exploration, I decided to study types of species generally found in all the landscapes.

Blog Post 7

User:  | Open Learning Faculty Member: 


The hypothesis that I set out is the overall ecology are healthy and varies in species as more land development induced in the region.


Land development involving human activities are sort of artificial selection activity. We measured the health of ecosystems in many ways by taking into account different sides  to measure their health. And the health of ecosystem depended on the landscape. Whether the landscape was actively managed by human was the independent variable, which derives in different environment where individuals shows different survival and reproduction rate. This offers an context with natural selection and artificial selection among ecological concepts.


Keywords that I would use to describe my hypothesis would include artificial selection, evolutionary fitness, vegetation abundance and diversity, bird activity, urbanization.