Recent Posts

Post 5 – Design Reflections

User:  | Open Learning Faculty Member: 


My initial data collection was not difficult.  The plot locations were easy to get to other than the 20cm of snow that was unpleasant, but otherwise the terrain is very accessible.  The data collected showed that there were actually very few regenerating cottonwood stems, which at first glance, I thought there would be substantially more.  There were also less coniferous species found than expected, but this could also be due to the fact that small stems are under the snow, or have been browsed.  The amount of woody shrub cover can make plots difficult, as there are a lot of plants to maneuver around.   The only modification I may make is increasing plot size from a 3.99 meter radius (50 meters squared) to a 5.64 meter radius (100 meters squared).  This could improve the accuracy of the estimated density of tree species, as a larger plot may pick up more species, improving the estimated density.  It may also be helpful to actually count the number of shrub species in the plot as opposed to estimating their percent (%) cover, as these plants could be the main reason as to why there are very few coniferous species establishing in the area.
Blog Post 9: Field Research Reflections

User:  | Open Learning Faculty Member: 


For my research project, I measured the abundance of English ivy in high-light and low-light conditions. The high-light environment was uncovered by tree canopy and the low-light condition was covered. I found that the abundance of English ivy was significantly higher in low-light conditions. Throughout researching, I did not have to make any significant changes to my research design and data collection went relatively smoothly. After collecting the data and reading the current literature I found this to be a very interesting topic to research and learn more about. Although my study design was relatively simple, it fits nicely in the literature and addressed some gaps.

This was my first time taking an ecology course and I have a much deeper understanding and appreciation of how ecology theory is developed and tested. it was very interesting to gain first-hand experience developing a research question and creating an experiment to answer it.

Blog Post 9: Field Research Reflections

User:  | Open Learning Faculty Member: 


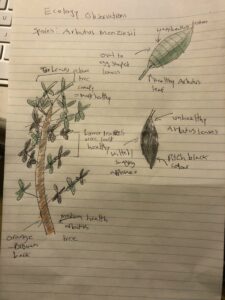
In summary of my field research, I sampled and took observations of the leaf health of 27 Arbutus Menziesii within Central Park on Denman Island, BC, Canada. I was assessing the health and size and local environments of these Arbutus trees because I noticed that a large proportion of the trees were suffering from ill health or disease with pitch black leaves and poor growth, despite living in a region that they’re theoretically well adapted to (mixture of dry and wet weather, close to the open, near elevated mineral soil, etc).

Once each tree was documented, sampled and data entered into spreadsheets I started to decide how I wanted to randomize the samples to produce replicates and remove bias.

I noticed that there were 5 clusters of Arbutus trees throughout the route that I surveyed the trees from: Groups 1 and 2 were in thick forest; Group 3 was in a medium thickness forest and an area with some open meadows; Group 4 had medium forest, mild cliffs and more open meadows while Group 5 had steep cliffs, thinner forest and more open areas. Each cluster had between 3-12 trees. To produce 5 replicates (2 similar samples each), I selected 2 trees at random using a random number generator from each clustered group, producing 10 samples or 5 replicates. This ensured randomization and removed any personal bias from the data analysis in advance.

This process wasn’t without issue. Due to overcast and bright weather, 5 of the 27 samples were not able to be analyzed for leaf health, as it was hard to tell if the leaves were black (unhealthy) or dark green (healthy). With only 22 samples to work with, the sampling still worked out as every site still had a minimum of 2 samples. If I had more time I would have revisited those 5 tree sites to redo them and improve the validity of the data I collected.

I found doing ecological field work like this helped me appreciate the ecological theory and understand it better. Theory is interesting and helps to internally solve problems, but its no substitute for going out into nature and applying that knowledge. I’m a more hands on person than theoretical so I found getting out and doing research to be rewarding.

Blog Post 8: Tables and Graphs

User:  | Open Learning Faculty Member: 


As my data collection I found 5 replicates of Arbutus trees by splitting 5 groups of clustered trees in different geographic regions, and then I assessed the health of each tree by estimating the proportion of healthy leaves on the tree.

I then took this data and graphed it producing a graph relating the % of healthy leaves vs each of the five groups to see if I could notice a trend. I then averaged each replicate (2 trees) per group to find the average of the leaf health in each group.

My hypothesis was that the poor health of the Arbutus trees along this route was primarily caused by poor access to sunlight and resources in the soil directly caused by competition with taller and faster growing neighbouring trees.

My prediction was that the regions that had more open areas, a shorter tree canopy, or niches where only Arbutus trees could easily grow (cliffs), that these regions would have the largest trees and the healthiest leaves.

This pattern was observed in the graphed data. As the landscape transitioned from a dense forest to open fields to elevated cliffs, the leaf health of the Arbutus trees did increase. The most open areas and those with cliffs had the greatest leaf health, those with the thickest forest had the worst health, and a zone in-between the two had moderate levels of leaf health, which is also to be expected.

Blog Post 7: Theoretical Perspectives

User:  | Open Learning Faculty Member: 


My hypothesis is that I believe that the Arbutus trees in this region are experiencing poor leaf health and disease as a direct result to the lack of sunlight reaching the trees due to competition with taller, quicker growing neighbouring trees who act to block out the sun to Arbutus trees and are less effected by poor sunlight than the arbutus is.

These neighbouring trees are more well adapted in a forest ecosystem than Arbutus are, and have developed evolutionary advantages over the Arbutus, and in most cases outcompete the Arbutus trees for resources and grow more quickly.

Keywords that I would use to describe my hypothesis would include competition, Forest ecology, photosynthesis, and evolutionary biology.

Blog Post 6: Data Collection

User:  | Open Learning Faculty Member: 


I sampled 5 replicates. Since my sample unit was individual Arbutus trees I could not take exact copies for replicate samples. Instead I made 5 groupings of individual arbutus trees that were clustered close together and then randomly selected 2 from each group, making 5 replicates or 10 samples.

In general the pattern that I expected held true with the majority of unhealthy and small arbutus trees belonging to areas with thick forests and tall tree canopies (creating unfavourable light conditions and overcrowding the soil), which would make the trees more susceptible to disease. Additionally the reverse was true, in that the largest and healthiest trees were growing on cliffs or wide open areas with few tall tree neighbours.

There was one sample that was completely unhealthy in an area I would have expected to be growing well (wide open area with little competition). It’s possible that this tree had poor soil conditions, or that there was more competition in the roots area, or that this area had a higher abundance of whatever microorganism was causing the diseased leaves.

I noticed that in some of the forested areas, Arbutus trees were attempting to grow sideways to  an open area (where the walking path was located), to escape the shade from the canopy of the trees, and that at least a few of the branches that grew sideways had healthier leaves.

Blog Post 5: Design Reflections

User:  | Open Learning Faculty Member: 


Did you have any difficulties in implementing your sampling strategy?

Yes, ~6 trees I was not able to record data for as the photos I initially took to analyse were too dark or too bright to tell the relative colour of the leaves. If I had done this analysis earlier I would have enough time to revisit those 6 trees to make a larger potential data set.

There were some surprises in the data. There was 1 tree in the thicker part of the forest that had 90% healthy leaves, which was much higher than the other trees in the same area (0-59%). You would expect that the area with the thickest forest would have hurt the growing chances of the tree. In this case the tree was quite tall in that. It was above most of the other tall trees, so this makes sense. It must have started growing before the younger trees had caught up to it. This area was recently logged so it gave at least a couple arbutus trees a chance to grow tall enough before the original forest took over.

There was one other sample that was interesting. It was Arbutus #7. It was a relatively small arbutus in an open area with few neighbours. 1 tree was directly overhead but wasn’t large, so maybe in this case the main issue wasn’t shade from the other trees but direct composition in the soil with neighbouring trees and a larger amount of brambles and bushes.

Otherwise the data did line up with expectations. Almost universally the the forested Arbutus were not healthy and small and larger healthier arbutus were found in the open areas and cliffs with fewer tall surrounding tree neighbours (including one huge tree with over 1000 leaves and with virtually zero damaged leaves).

Blog Post 4: Sampling Strategies

User:  | Open Learning Faculty Member: 


The fastest technique was Distance: Haphazard which completed in a total of 11 minutes. The slowest was Area: Haphazard and Area random at 33 and 32 minutes each.

The most accurate method seemed to be Distance: Haphazard. Species that were found to be in high abundance seemed to have very large percent errors (300-900%).

Comparing the relative frequency of our sample to the actual value for the 2 most common and 2 rarest species, gave the following data:

Area: Haphazard:

Black Tupelo: 20 vs 4.2 = 376% error

Red Maple: 20.0 vs 35.0 = 42.85% error

White Oak: 20.0 vs 13.5 = 48.15% error

Chestnut Oak: 20.0 vs 10.8 = 85.19% error

Average error = 138.05%

33 minutes

Distance: Haphazard:

11 minutes:

Red Maple: 50 vs 35 = 42.86% error

White Hazel: 50 vs 13.8 = 262% error

Total % error: 0.6/1.8 = 66.67% error

Average: 123.78% error

Area: Random:

32 minutes

Eastern Hemlock: 20 vs 4.6 = 335% error

Chestnut Oak: 19.2 vs 9.4 = 104% error

Witch Hazel: 20 vs 13.8 = 45% error

Red Maple: 20 vs 35 = 43% error

Average = 131.75% error

Distance: Random:

12 minutes

White Oak: 25 vs 13.5 = 85% error

Witch Hazel: 25 vs 13.8 = 81% error

Red/Black Oaks: 25 vs  9.2 = 172% error

Sowny Juneberry: 25 vs 2.3 = 987% error

Average = 331.25% error

Blog Post 3: Ongoing Field Observations

User:  | Open Learning Faculty Member: 


The organism I am studying is the Arbutus species native to southern British Columbia and the Pacific Northwest in the USA: Arbutus Menziesii. The biological attribute I am examining is the health and colour of the foliage of the tree, as Arbutus trees in this area seem to be in varying health dependent on location (the environmental gradient).

I sampled 21 trees from 15 locations, and further divided these locations into 5 closely clustered regions as a way to measure how different environments effect the species and environmental gradient. The first grouping (1) contains 3 locations and 4 trees in a thick forested region. Group 2 contains 4 locations and 5 trees in a less dense forested region. Group 3 contains 3 locations and 3 trees in an even thinner forested region with some areas that appear open and free of large trees. Group 4 contains 2 locations and 2 trees in an area that is filled with sparse forest and more regions of cliffs and a lack of tall trees. The 5th group contains 3 locations and 9 trees. This area has the most open spaces, sparse vegetation and open cliffs.

In general Arbutus trees seemed to be smallest and with a larger proportion of unhealthy leaves in forested areas, and particular in areas where the surrounding area consisted of tall trees above the arbutus species.

The largest arbutus trees with the most healthy leaves were all in the least forested areas and particularly those growing on the cliffs.

The black leaves may be caused by a fungus or other microorganism, but I believe that trees that face environmental factors that hinder their ability to grow and stay healthy will be more susceptible to disease. In particular I believe that Arbutus trees have a very hard time growing and staying healthy in areas where they are overcrowded by the canopy of taller trees and competition for resources in the soil, hence why I have observed trees in poor health all in heavily forested areas with tall tree canopies, and very little ill health on cliffs and in sparsely patches of forest with smaller trees. Other factors such as access to water can be discounted as Arbutus trees are very hardy and can withstand long periods of drought. Additionally the unhealthy leaves persisted throughout the summer and the winter, which are periods where Denman Island experiences a dry season and then a wet season. 

Blog Post 2: Sources of Scientific Information

User:  | Open Learning Faculty Member: 


The source I have chosen is a review article in the peer reviewed Scientific Journale: “Philosophical Transactions of the Royal Society B” titled “The niche, biogeography and species” by “Dr. John Wiens”:

https://royalsocietypublishing.org/doi/full/10.1098/rstb.2011.0059

This review article is about how the ecological concepts of niches relate to the field of biogeography. The author also describes how patterns in biogeography are related to species niches. Niches are the combination of biotic and abiotic conditions that allows individual species to live in different areas or zones.

Of the four categories of informations sources, I believe that it belongs to “academic peer-reviewed review material”. This article is published in a peer reviewed, scientific journal and the author has stated in the abstract that the paper is a review article specifically. The paper also does not contain a methods or Results section.