For my project regarding canopy closure and deciduous trees, I chose to do a bar graph. At first, I had a hard time deciding which type of graph showed the data effectively without confusion. This was a bit of a challenge due to having a large amount of data. In the end, I chose a bar graph as it clearly showed all the necessities while still providing a clear understanding of what was happening. The outcome of my data was mostly as expected, the only thing that surprised me was how little deciduous trees resided in a canopy closer <60%. I knew that the numbers would be significantly less than in open canopy areas but the fact that none were present <30% was truly surprising. if the study were to be conducted again more accurate canopy closure should be measured using photography. Due to randomized plot location, our data set was somewhat narrow with significant data lacking in canopy closure of 40-60% range. In future studies, non-randomized plots could also be implemented to ensure a broad data set was derived.
This is academic, peer-reviewed, research material.
This is an academic paper as it was written by experts in the field of wildlife and biology, it includes in-text citations, and contains a bibliography as well. This is peer-reviewed material as all published works in this particular journal (Royal Society Publishing) must be peer-reviewed before publishing. Finally, this is research material as there is a type of methods section, as well as a results section.
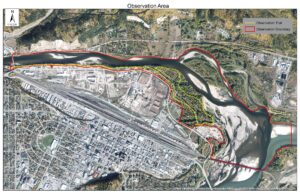
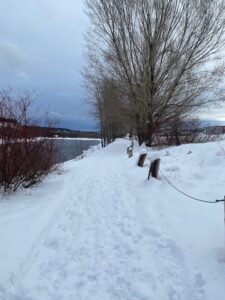
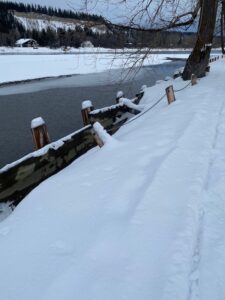
For my field observations, I have chosen Cottonwood Park in Prince George, BC. This is an interesting area, as it is a city park where the Fraser River and the Nechako River meet, but the majority of my study area only includes the Nechako river. This area is a river bottom, which is surrounded by industrial sites on the south side, and a very steep cut bank on the north side. My study area is in the SBSmh and is approximately 200 hectares in size, which includes the area of the adjacent rivers, but my observations will mainly occur on a 4.8km trail that I walk regularly (Figure 1).
Figure 1
However, I rarely walk the whole trail loop each time. As I do walk there often, I usually walk different sections at different times of the day and/or week.
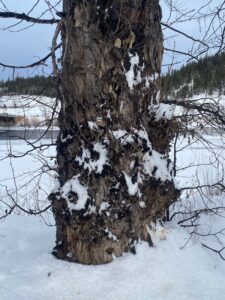
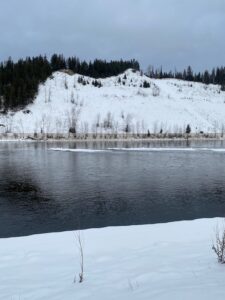
To begin my observations, I walked the western portion of the trail on December 17, 2019, from 12:00-12:50pm. The sky was overcast, it was very windy, and was approximately 4 degrees. There was a big snowfall on the previous day, about 10-20cm, but it is already starting to melt due to the temperature. This park, as one could likely have guessed, contains many cottonwood trees. There are big veteran cottonwood stems all along the river bank, as well as many regenerating clones in the understorey.The understorey vegetation is surprisingly limited for a seemingly wet site. The only noted species were red-osier dogwood, black hawthorne, saskatoon berry, mountain ash, rose, as well as some different grasses. Parts of the river are frozen at this time, but only at the edges or in shallower areas. There isn’t much as far as animal signs, other than squirrel sightings today. However, as I do spend a lot of time here, I have seen chickadees, magpies, ospreys, hawks, eagles, hares, foxes, and bears during other visits. There are many signs of erosion here, as the trails have had to be moved in some spots, the retaining walls have begun to fall, and the concrete is cracked and broken throughout.
Some observations that I have made that may have potential for a research hypothesis are:
Does the fur color of hares change due to temperature or snowfall?
There appears to be only one fox that occupies the area, is this due to food, habitat size, predators, or industrialization in the area?
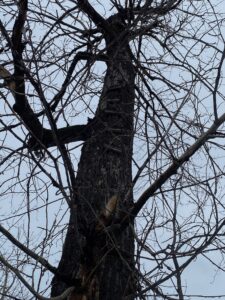
Do cottonwood trees that are closer to the river rot faster or slower than those closer to the road?
The theoretical basis of my research project is the conditions in which English Ivy thrives. I hypothesized that English ivy will be more abundant (have a higher percent cover) in the conditions where there is limited sunlight. My research project is centred around the conditions needed to support the Ivy growth, my research focus is sunlight but this may translate to other factors such as moisture and soil type. After doing some research I have discovered that English ivy is an invasive plant in British Columbia and I think this is a very interesting context to place my research in as well as being another underlying theoretical perspective. The characteristics of the ivy could be explained by its invasive nature. The pattern of growth can be related to surrounding vegetation and further investigation could be done on not only the English ivy but the plants around it.
Three keywords for my research project would be: percent cover, sunlight access, and invasive species.
During my field data collection, I collected 10 replicates from each of my two substrates, access to sunlight (uncovered from tree cover) and limited access to sunlight (covered by tree cover), this amounted to 20 replicates in total. I collected my replicates using a 1.0 by 0.5 meter quadrat and collected them along a transect in a straight line and randomized my steps between each sample. The quadrat was placed beside where my foot fell on the last step. After my initial collection, I had considered doing a point count rather than a percent cover but decided to stick with my initial measurement method of percent cover as the vast majority of the cover was English Ivy with few other plants to have to work around so I decided I will have adequate accuracy using percent cover. I did not face many challenged when collecting data, besides having to be very careful walking around the Ivy as it got very thick in some areas and I did not want to harm them! I did not notice any patterns that made me reflect on the hypothesis. My two substrate areas are very close in proximity, the major difference I observed between them being the tree line where the forest canopy starts and stops but it creates a drastic difference in the abundance of the Ivy.
The three sampling strategies I used in the virtual forest were, Distance-systematic, Distance-random, and Distance-haphazard. The results from the three strategies were similar in that species percentages remained in order, and no strategy sampled any White Pine.
Of the three strategies I used, Distance-systematic had the fastest estimated sampling time at 4hrs 16min, followed by Distance-random at 4hrs 30min. The slowest estimated sampling time belonged to the Distance-haphazard strategy, at 4 hrs 49min.
Species:
Eastern Hemlock(EH), Yellow Birch(YB),Striped Maple(SM), White Pine(WP)
As can be seen, the accuracy varied between species abundance in the different sampling strategies. As per my virtual forest survey, it can be assumed that species does not affect accuracy. The only consistent % error was with White Pine, which was not sampled in any of the three strategies I used, and therefore had a % error of 100%.
The least accurate of the strategies was Distance-systematic, while the other two were fairly similar in their accuracy.
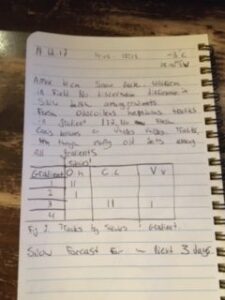
In my study area at Fish Creek, I have noted frequent traffic by large mammals in the form of tracks in the snow. I have decided to study the patterns of travel used by the area’s large mammals. Specifically, I will be focusing on Odocoileus hemionus, Canislatrans, and Vulpes vulpes. Though I have noted the presence of Alcesalces tracks, I believe them to be too intermittent of visitors to the area to use as a focus species, though I will continue to note their presence.
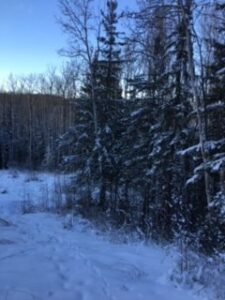
I will be using four gradients to observe the presence of these mammals. First, the top of southern slope of the Fish Creek gully. This is the open grassland of the golf course. So far, this gradient appears to have the heaviest traffic from Odocoileus hemionus. The second gradient is mid slope on the southern slope, approximately 70% Picea Glauca, 30% PopulusTremuloides, with a mostly closed canopy. This gradient also includes an open pipeline right of way. It is steep, about 70%-90% slope with level benches contouring the hill. Here, there is presence of tracks from Canislatrans, Vulpes vulpes, and Odocoileus hemionus.
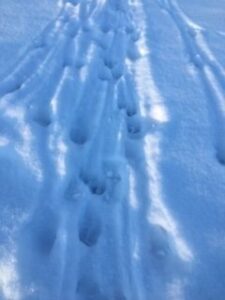
Odocoileus hemionus tracks, Gradient 2
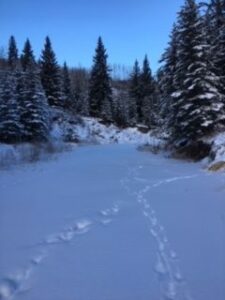
The tracks from the canine species seem to go cross slope as well as up and down slope, whereas the tracks from Odocoileus hemionus descend from the first gradient and then cut cross slope along apparently established paths. The third gradient is the gully bottom. This gradient is mostly open, though the steepness of the banks gives it an enclosed feeling. The watercourse of Fish Creek runs through the middle, frozen now, likely for the winter. It is often shaded, and on the level banks of the creek grows mostly grasses and a few shrubs, though these are now buried by snow. In this gradient there is presence of Canis latrans and Vulpes vulpes tracks, often following the frozen watercourse.
Canis latrans tracks, Gradient 3
The fourth gradient is the northern slope (south facing). This gradient is steep (>100%) and open with only the odd small Populustremuloides present. Here I have noted a few Odocoileus hemionus tracks, though they are becoming less frequent as the snow continues to fall.
These four gradients are a good representation of a common geographical feature here in the Peace River region of BC. There are many steep gullies with waterways at their bottoms and fields at the top. Where the waterways run West-East, they have both north and south facing slopes with very similar topography and vegetation to my study area. the three species I have selected to study are also very common in the Peace River region and, though the scope of my study in this course will be too narrow to cover it, I would expect to find similar behavior among these species in other areas in the region that are similar to my study area.
Based on my observations, my hypothesis is that Odocoileus hemionus, Canislatrans, and Vulpes vulpes will use the north facing slope most frequently for travel in the winter months. I predict that as snow continues to fall over the winter months, the open south facing slope, gully bottom, and the top of the southern (north facing) slope will house the deepest snowpack of the gradients, while the mostly covered southern mid slope gradient will have less snow accumulation on the ground. I believe this will lead to heavier traffic from large mammals, seeking easier travel routes. Based on the above, the response variable will be the abundance of Odocoileus hemionus, Canislatrans, and Vulpes vulpes tracks present at any given gradient (categorical). The predictor variable will be snowpack depth at the different gradients (continuous).
My sampling method was using a 0.5 by 1.0-meter quadrat to measure the abundance of the Ivy in light and dark environments. There was not too much difficulty when collecting data this way as the results I observed were not surprising. It was a bit difficult to subjectively determine the percent cover but I marked my quadrat at 25cm and 50cm intervals to show an area of 25% to assist in judging the percent cover. Some replicates included other plants so observation of measurement had to be done without taking those into account. I am considering changing to a point count way of measuring as this may change the precision of my measurements but am wondering if this will be suitable for the English Ivy as some replicates had a large abundance that individual Ivy leaves would be difficult to count and I would need to determine what counted as a leaf being “inside” the quadrat. I will consider this however, percent cover did yield good results.
I had no prior post-secondary background in ecology and this course has given me a good glimpse into this field. Conducting the experiment enabled me to see the work that ecologists have to undergo in order to form ecological theories. Performing the field work myself makes me more appreciative of what ecologists do.
The implementation of my research project was pretty straightforward but I did have to slightly modify my experimental design to work more cohesively with my particular research topic. Simply going out to count flowers in the park was not enough. I had to take into account different factors that I hadn’t considered before this project, including the fact that flowers can “migrate” by attaching to humans and animals and by being deposited in other areas (whether within the park or not). Lastly, because this is scientific research, I cannot assume anything is just the way it is based on what I have observed, but rather, I must investigate why things are the way they are.
Your second post will concern sources of scientific information. Find one source of ecological information. It can be online, from the library, or from a book on your shelf. Based on what you have learned in the “How to evaluate sources of scientific information tutorial”, create a post in which you a) say what the source is (and/or link to it), b) classify it into one of the four types of information discussed in the tutorial, and c) provide documentation to support your classification.
“Land Use and Avian Species Diversity Along an Urban Gradient”-Robert B. Blair , 1996
academic peer reviewed research material
The source is written by an expert in the field as the author is professionals in the field and it contains in-text citations and a bibliography. Also there is a mention in acknowledgment section in the source therefore this paper is academic peer reviewed article. Also the research contains methods and results of an experiment held in the project, therefore it is an academic peer reviewed research material.