Recent Posts

Post 1 : Observations

User:  | Open Learning Faculty Member: 


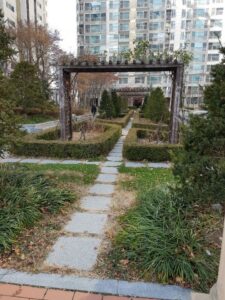
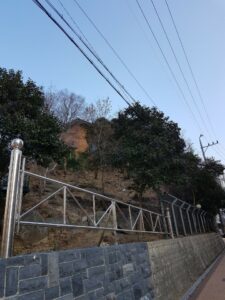
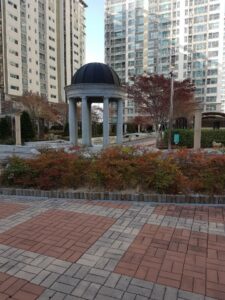
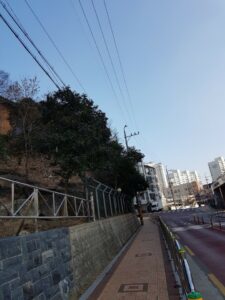
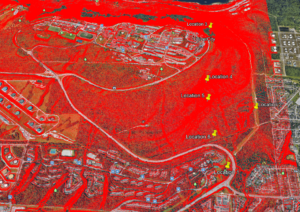
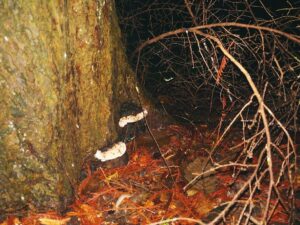
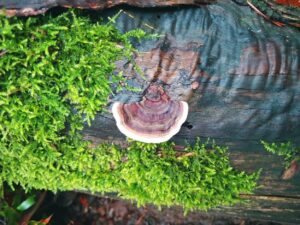
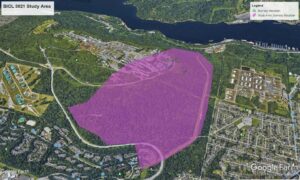
The area that I choose to observe is two area, that is close to home. Because I thought it would be more accessible and it would be easier for me visit anytime I want. I live in South Korea, Daegu. The location I choose first for the research is a park built in apartment complex I live in and the second is protected forestation area around nearby church. Although the apartment complex area is called a park, it is fairly small so it would be likely called as city street with ornamental trees and shrubs. The protected area nearby chuck is somewhat forested. I visited these area at December 14th, 2019 around 10:30 AM. The topography in apartment park is flat, while the protected area is small hill/ slope. The weather was sunny and temperature ranged around 8-9 degree celsius.


The idea I thought as I observed these area was mainly related to artificial intervention on nature, and can be pointed in majorly three points.

  1. Were the various plant types in the park in the apartment complex only possible due to artificial intervention? So, can plants under artificial intervention go against the theory of natural selection? If so, in how much degree?
  2. Compared to the park and other naturally formed plant landscape, a plant species thatis only at apartment complex park, Does this apply to artificial selection or invasive species?
  3. The apartment complex park continues to maintain a much more visually beautiful appearance due to the care of the caretaker, compared with other naturally formed plant landscapes. Does this affect communication between different species each other?


All of the questions are derived from one big idea; Whether artificial intervention affect ecology or not. From this main idea I will derive more specific points as I go through the research.


Post 8: Tables and Graphs

User:  | Open Learning Faculty Member: 


Prior to going into the park, I already knew that I wanted to collect my data in table format versus writing a summary for each quadrat. I did not have initially know what data I wanted to collect until I went to an area of the field where some dandelions were located. This initial assessment was not included in my final data collection but served as a way for me to decide what information I wanted to take note of when summarizing each quadrat.

I eventually decided on the following columns for my table: location of quadrat, total number of flowers, flower type, number of each flower type, and other notes.

My results were as expected because the northern (both northeastern and northwestern) areas of the park had the greatest number of flowers. These results were similar to my initial observations when I only included dandelions. Surprisingly, the centre quadrat had more flowers than I expected, considering it is a flat-lying area and is typically walked over often by both humans and animals.

Post 7: Theoretical Perspectives

User:  | Open Learning Faculty Member: 


My study initially investigated the abundance and distribution of dandelions in an urban park. However, because I observed that dandelions were not present in the park throughout the whole year, I will explore the abundance of flowers (in general) in different areas of the park in relation to the frequency of human and animal use. The reasoning behind this idea is through observations of a greater amount of flowers in areas of General Brock Park that humans and animals are less likely to frequent or use.

Three keywords that can be used to describe my research project are: flower, abundance, urban parks

Blog Post 3

User:  | Open Learning Faculty Member: 


I plan to study the fomitopsis pinicola mushroom.


Study Area with 6 locations and altitude overlay


I selected 6 locations to look for the mushroom along an altitudinal gradient on my two visits to the study area. Location One is 64 meters above sea level. In location One I was able to find the mushroom on a dead log and near the roots of a living tree. The first location is located in a wooded area near a small stream. The second location is at 128 meters and is up the power line trail, I was not able to find the mushroom. The Third location is at 195 meters and is on a trail with trees and shrubs on both sides just off the power line trail, I was not able to find the mushroom. Location Four is at 205 meters and location 6 is at 258 meters. In locations  Four and Five I was able to find the mushroom on two logs. Both location 4 and 5 are deep within the forest; however, they were right off a trail.  Location Six is at 96 meters. Location Six is near the trail end but still in the forest I was not able to find the mushroom.


Mushroom on tree

Mushroom on log

I think that the altitude of my study area does not affect the abundance of the mushroom. Based on this hypothesis I think that I can find the mushroom at any altitude of the study area. As this hypothesis is limited in that the Burnaby Mountain does not reach different Altitudinal Zones such as Subalpine I have created a second hypothesis. There is a positive relationship between the presence of dead logs in an area and the presence of the mushroom. Based on this hypothesis the more dead logs I find within an area the more I will find the mushroom.


The response variable is the presence of the mushroom. The explanatory variable is the dead logs the mushroom grows on. Both my response variable and my explanatory variable are categorical because the mushrooms are only found in very specific conditions such as on a living tree or dead log.

Blog Post 1 – BNelson

User:  | Open Learning Faculty Member: 


The area I have chosen is part of the Burnaby Mountain Conservation Area shown below.


Study Area

The area is 1.85 km2. The part of the mountain I have chosen rises from roughly 160m to 290m above sea level. The majority of the area I have chosen is covered in forest with hiking trails and a high voltage power line going through. I have visited my site twice once on November 24th at 3:30pm. The temperature was around 7 C and the ground was wet. The second time was on December 8th from 1:00pm-3:00pm. The temperature was around 10 C and the ground was wet. The animals that live on the mountain include deer, squirrels, coyotes, raccoons, mice, rats, steller’s jay, and humming birds. There are many varieties of plants including ferns, maple trees, dogwood, Douglas fir, western hemlock, an

Power line Trail


Forest Area

Red cedar. There are an innumerable amount of fungi. I have included several photos of the trail showing the power line surrounded by grasses and small shrubs in Figure 2, a mountain train in Figure 3 surrounded by forest and ferns.

The area is popular for dog walkers and mountain bikers. As such seeing any animals besides squirrels is uncommon as they shy away from humans. From my walks I had the following questions:

  1. Fungi are abundant in the forest why there are not any along the power line trail?
  2. What trees are indigenous to the area and which have been brought in?
  3. What parts of the study area have been logged if not the whole area in the past 100 years?

Sources of Scientific Information

User:  | Open Learning Faculty Member: 


For this assignment I chose two sources to discriminate among different sources of information. The main tool I used was our online tutorial flow chart and associated readings from Module 1.

A) Book off my Shelf

Title: The New B.C. Roadside Naturalist A Guide to Nature along B.C. Highways by Richard & Sydney Cannings

B) classify it into one of the four types of information discussed in the tutorial

Non-academic material

C) provide documentation to support your classification

There are no in-text citations and it does not contain a bibliography though is was written by an expert in the field.


A) Textbook on my desk

Title: Freedman, B., Hutchings, J., Gwynne, D., Smol, J., Suffling, R., Turkington, R., Walker, R. & Bazely, D. (2015). Ecology: A Canadian Context. 2nd edition. Toronto, ON: Nelson Education.

B) classify it into one of the four types of information discussed in the tutorial

Academic peer-reviewed review material

C) provide documentation to support your classification

Ecology: A Canadian Context was written by experts in the field, has in-text citations and references. In the acknowledgements section it thanks colleagues for their review efforts. It does not have a methods and results section which means it is not research material.


Lost Lake, Mundy Park, Coquitlam, BC – Elise Galuska

User:  | Open Learning Faculty Member: 


Weather/Temperature Date Location Time Animals Plants
Overcast, light drizzle, 8 degrees Celsius 6-12-2019 Lost Lake, Mundy Park,

Coquitlam, BC

1400 – 1445 Hooded mergansers Red elderberry – Sambuca racemose
  Raven – auditory Western redcedar – Thuja plicata
  Douglas-fir – Pseudotsuga menziesii

As I arrived at the Lake it was shrouded in mist, obscuring my view on the north side. As I continued to observe the plant life at the lake, the mist started to lift and that is when I noticed the hooded mergansers. The male was showcasing his display for the female. The female would start to come closer to the male then retreat. This was repeated many times, only interrupted by their diving underwater.Lost Lake is found on the eastern side of Mundy Park in Coquitlam, BC. It is a small lake in a dedicated forested (City park) surrounded by urbanization of residential housing and schools on all sides. Lost Lake is the smaller of the two lakes in Mundy Park, the larger being Mundy Lake. Lost Lake is special in that it is known to house a species-at-risk, Western Painted Turtle – Coastal Population and to provide possible habitat to other species-at-risk such as the red-legged frog and the pacific water shrew. It is a permanent body of water, that is usually still with an outflow on the southeast corner into Lost Creek that flows in a general southerly direction toward the Fraser River.

The vegetation surrounding the lake is mainly conifers with some deciduous shrubbery closer to Lost Creek. The majority of shrubs were devoid of leaves but some had leaves turning colour. The red elderberry had bright yellowed leaves, of the leaves still remaining on the shrub.

Lost Lake is inaccessible to park users on all sides except on the south side, where I stood, there is a viewing area with benches. There is also a trail that goes near the lake on the west side, that runs north – south, but it does not allow access to the lake. I observed many park users walking their dogs off-leash here and some of the dog owners were throwing balls off-trail for their dogs to go and find in the forest.

The lake is about 170 metres long running north to south and about 50 metres wide from east to west. I’ve been to this lake many times throughout the different seasons but this is the first time I’ve seen hooded mergansers using the lake.

  1. Why are hooded mergansers on the lake at this time of year when I have not observed them at any other time of year on the lake before?
  2. Is there noticeable degradation of the forested area by park users between Lost Lake and the nearby trails systems?
  3. Inventory – what is the species diversity of Lost Lake in Winter?


Post 2 Scientific Sources

User:  | Open Learning Faculty Member: 


The article I chose is The Importance of fungi and mycology for addressing major global challenges. The article was published in the IMA Fungus in 2014. The IMA Fungus is the official journal of the International Mycological Association. The article was written by Lene Lange. Lene is a professor in the Department of Chemical and Biological Engineering at the Technical University of Denmark. The article is review of the current literature and how mycology can be used to address global challenges. There are in text citations and a list of references. There is no list of referees; however, because the article has been published in the IMA Fungus, I think it is an academic article that is not peer reviewed.


Lange, L., (2014). The Importance of fungi and mycology for addressing major global challenges. Retrieved from https://www.ncbi.nlm.nih.gov/pubmed/25734035

Blog Post 3: Ongoing Field Observations

User:  | Open Learning Faculty Member: 


I returned to the study site on September 28th, 2019 between 09:00 and 11:00. It was partly cloudy with light winds, and approximately 12 degrees Celsius. The biological attribute I plan to study is the relationship between tree species and the river. I would like to focus whether there is a correlation between the type and abundance of trees and shrubs, and the proximity of the river in regards to each species. 

Since my last visit to this area, many of the leaves have changed color and dead leaves are scattered along the trails and river. The river has not changed and continues to flow moderately. 

There are 3 different gradients along the site that I have observed:

Gradient 1: Closest proximity to the river bed (0-15 feet). This gradient consists primarily of large Red Alder trees, majority of them are leaning towards the river. Dispersed around the alder trees are Salmonberry shrubs. Moss is covering the approximately 60% of the rocks and lower parts of the trees.

Gradient 2: 15-30 feet from the riverbed. A thick row of fern can be seen as the gradient becomes elevated by 5 feet at approximately 15 feet from the river bed. Weaved within the ferns are very few Salmonberry. Further back into this gradient are a few Western Hemlock, Vine Maple, and Red Alder.

Gradient 3: 40-60 feet from the river bed, elevated about 15 feet. Various species of Maple, including Bigleaf and Vine Maple dominate this area. Need to research and return to the site to see if there are other types present, as it can be difficult to distinguish since there is a high density. Western Hemlock and Cedar are present in larger numbers and density than gradient 2.

A few things to consider about this site:

There is an overall elevation level of 15 feet, which could contribute to the change in vegetation, especially depending on how far the water table is underground. The forest is overall very dense, and majority of the light coming through is due to either fallen trees, or man-made trails that run through. The river is about 20 feet wide, and lets a considerable amount of light in. This could be another variable as to why the trees along the river bed are leaning inwards.  Majority of the moss in the area can be found close to the river, which could mean that moisture levels in the air are higher overall. 

My hypothesis:

The species of trees and shrubs that are closest to the river require more water and sunlight than trees further from the river.

Prediction:

My predictions are that Red Alder and Salmonberry require better access to water sunlight than the species present in gradients 1 and 2. Western Hemlock and Ferns are able to survive off less sunlight and a moderate amount of water. Maple trees require less water, but can grow tall enough to get adequate sunlight. 

Response Variable:

Tree and Shrub Species – Categorical

Explanatory Variable:

Proximity to the river – Continuous


Blog Post 8: Tables and Graphs

User:  | Open Learning Faculty Member: 


I chose to use a table to represent the field data I collected in this study. My table depicted a summary of each species I found at the range of elevations along the slope, and the percent canopy coverage of those species. Also included was quadrat size, location, and area covered by each species. Many species appeared in more than one elevation location. Lower elevations were dominated by pine grass and clover. Mid elevations primarily displayed the common fern and Saskatoon berry bushes. Finally, the highest elevations I recorded data for (10-11 m above the base of the slope) were dominated by the Lodgepole Pine and Paper Birch. I had no difficulty in organizing and aggregating the data. I may be able to summarize the information more concisely in graph format for the final report. In graph form, I would be able to show how individual species percent canopy cover changes across the entire slope in a more understandable visual way, rather than listing the species found at each site and their coverage. The outcomes of this data conformed to my expectations, nothing new was revealed. As predicted, more complex plants were more abundant at higher elevations, perhaps due to more sunlight exposure, or a change in nutrients found upslope. For further exploration, a more comprehensive study could be undertaken to determine if this pattern applies to the entirety of Terrace Mountain, or only on this specific slope.