Recent Posts

Blog Post 1: Observations

User:  | Open Learning Faculty Member: 


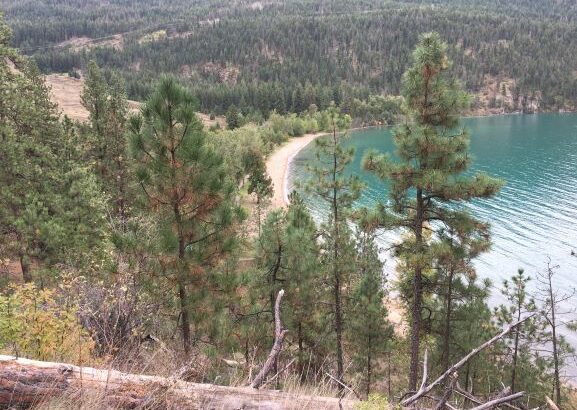
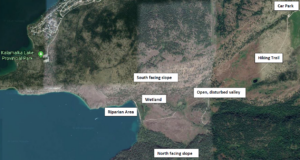
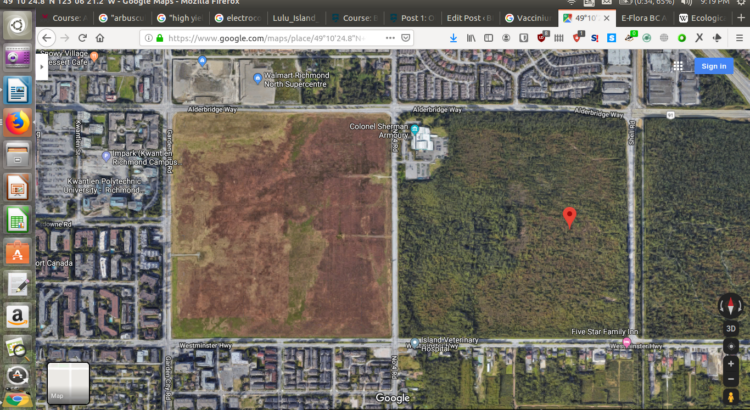
The site that I selected was the peat-lands in the DND Lands in Richmond, BC, between No. 4 Road, Shell Road, and the Westminster Highway. The coordinates for my initial observation point were 49°10’24.8″N 123°06’21.2″W, and my first observations were conducted at 12:15PM, on Sunday 29th of 2019. This particular portion of peat-land does not have an official geographical name; however, it has historically been considered a part of the greater Lulu Island Bog.

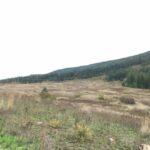
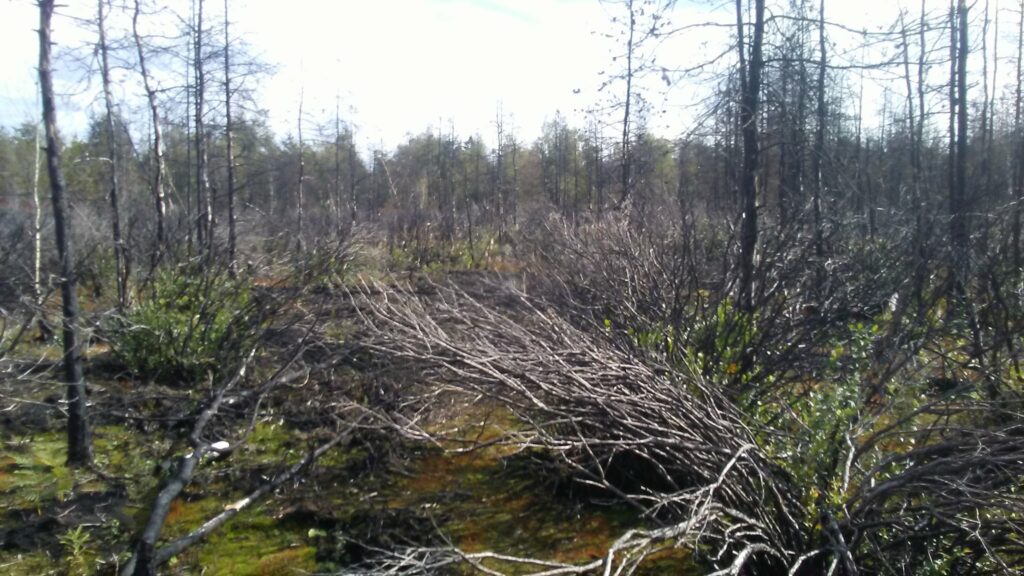
While visiting, the weather was sunny, and 16C. The terrain appears, for all intents and purposes, to be flat, although most peat bogs are known for being either domed, or gently undulating. The particular area that I first explored showed signs of having been subjected to fire in the passed few years. This observation is in line with what I would have expected; in July of last year, I observed the first signs of what was most likely the fire that caused the damage I was currently observing, while I worked at Kwantlen Polytechnic University’s Garden City Land’s farm in 2018, which is located on the parcel of land just west of the DND lands (west of Number 4 Road).

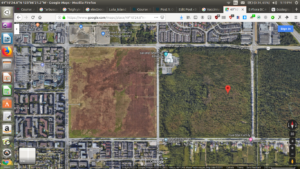
(Aerial view of the DND Lands, inbetween the Garden City Lands, and the Richmond Nature Park. Google Maps.)

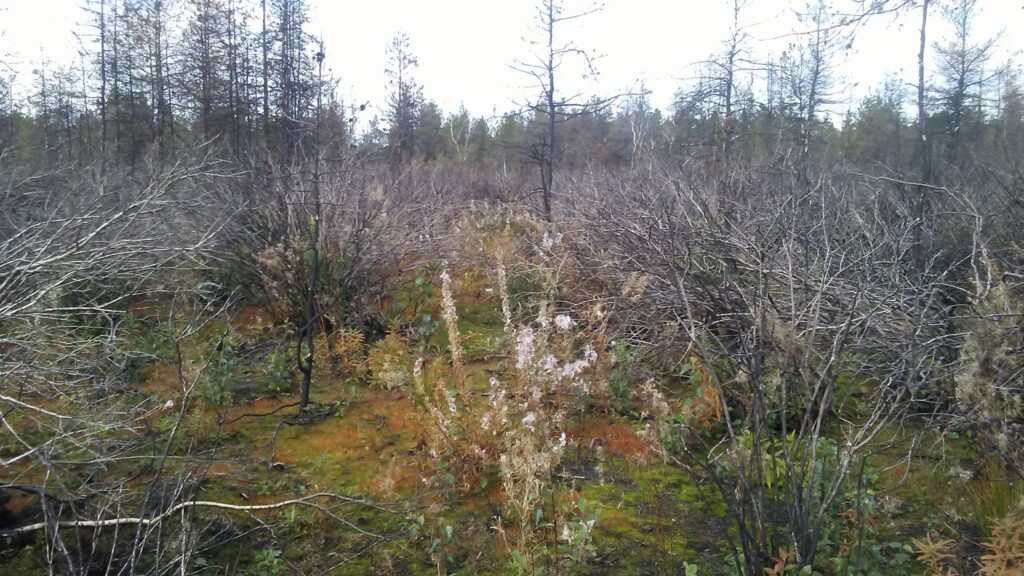
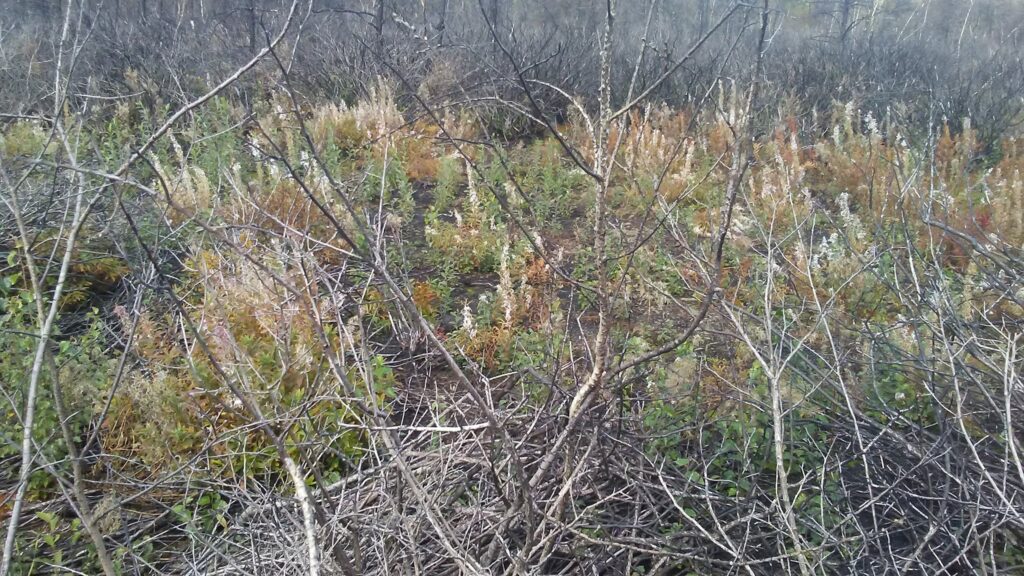
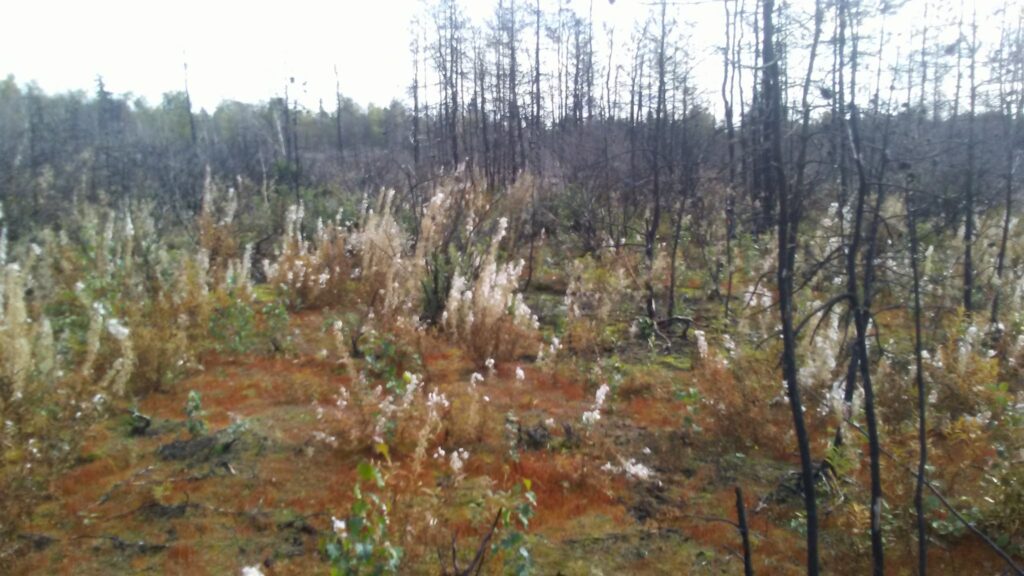
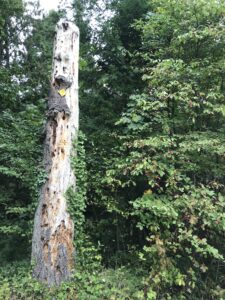
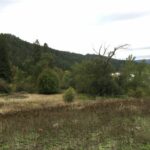
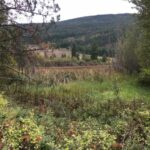
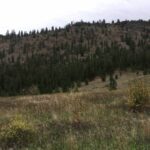
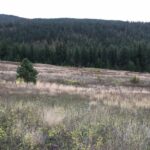
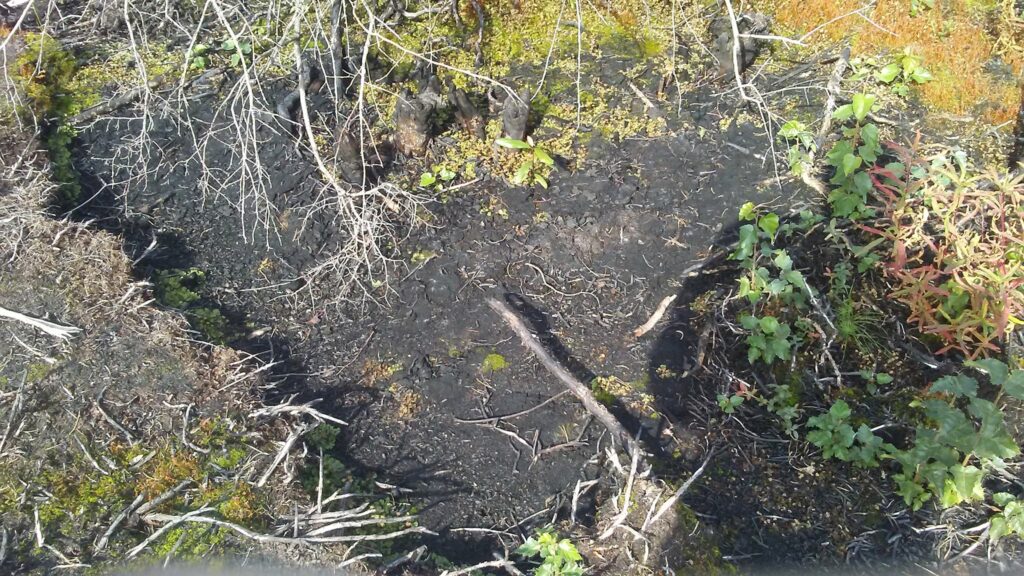
(Above images: Images of burnt over areas observed at initial observation site.)


What struck me about this particular peat-land, besides the blackened Vaccinium spp. shrubs, and shore pines (Pinus contorta var. contorta) (1), was the abundance of invasive Scotch heather, Calluna vulgaris (2), which was regenerating vigorously after only a year since the bog fire took place, along with the proliferation of the seedlings of another alien invasive species, the European birch, or Betula pendula (3). In many places it appeared as if the two species were the primary pioneer species on burnt and exposed sphagnum based peat soils. It also looked as if a lot of the primary fuel for burning may have come from a dense under-story of low shrubs, because the trees and Vaccinium spp. were burnt from the bottom upwards. In a few spots I did notice black pits surrounding larger trees and shrubs that had died from burning, and I suspect that this is where subterranean peat fires may have followed dead roots to the surface, where they may have broke out, and ignited surface fires amongst what appears may have been dense, fine branched, low growing, woody vegetation, most likely Ericacious.

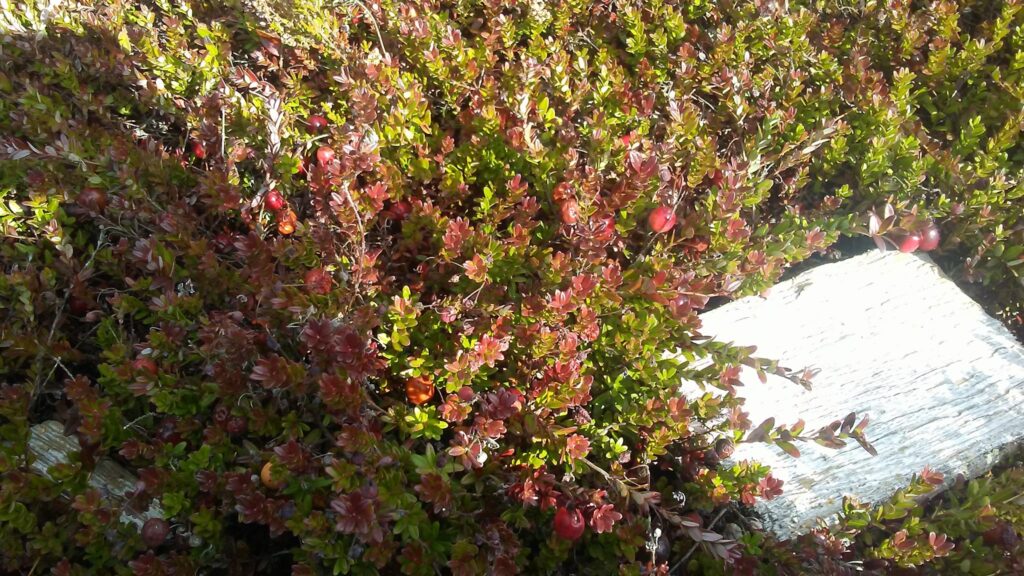
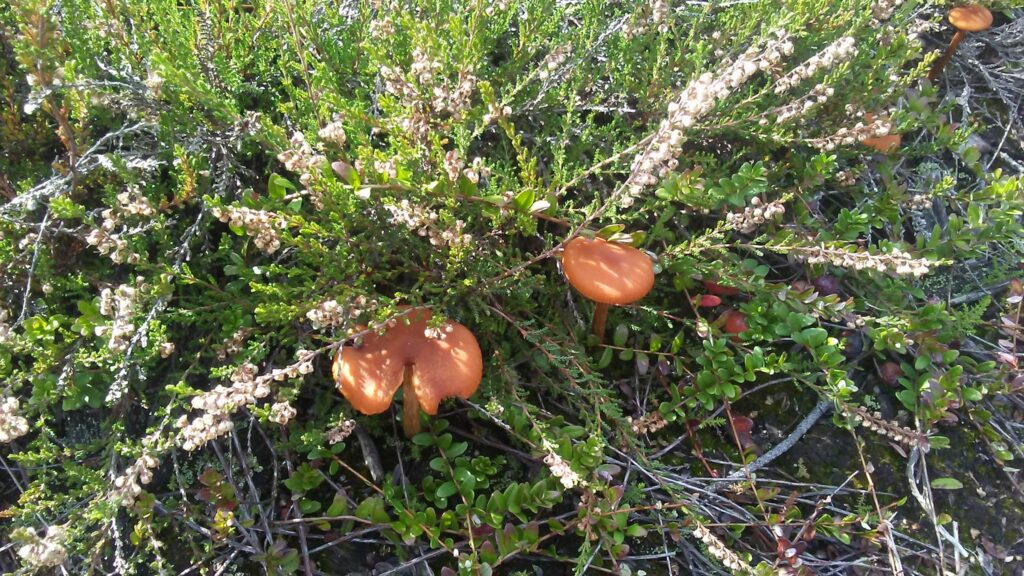
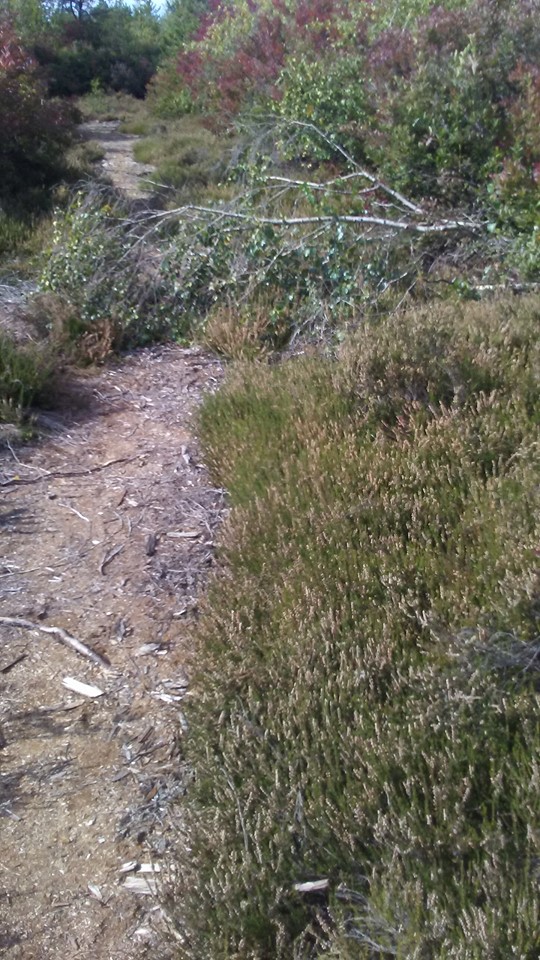
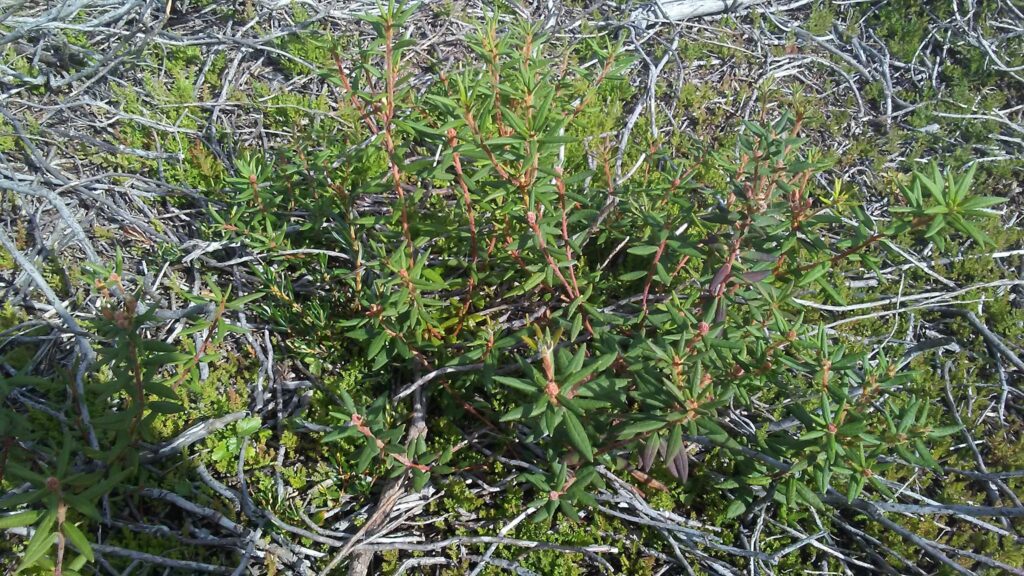
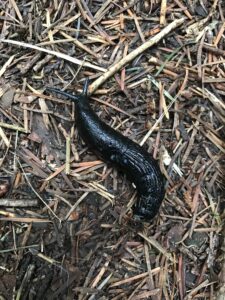
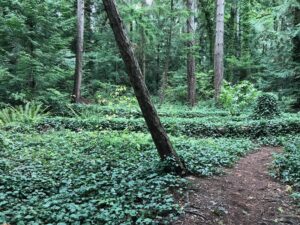
(Above images: Images of vegetation within the bog, clockwise from left to right; Vaccinium spp., cranberry, have yet to confirm the species, young Scotch heather, Calluna vulgaris, colonizing fire effected area, mature C. vulgaris growing with an unknown fungus, northern Labrador tea, Rhododendron tomentosum (4), growing in a cut over firebreak close to burned area, mature C. vulgaris growing beside a trail in part of the bog that was not effected by the fire, and a C. vulgaris seedling growing in the wheel-track of what I’m assuming was a firetruck.)

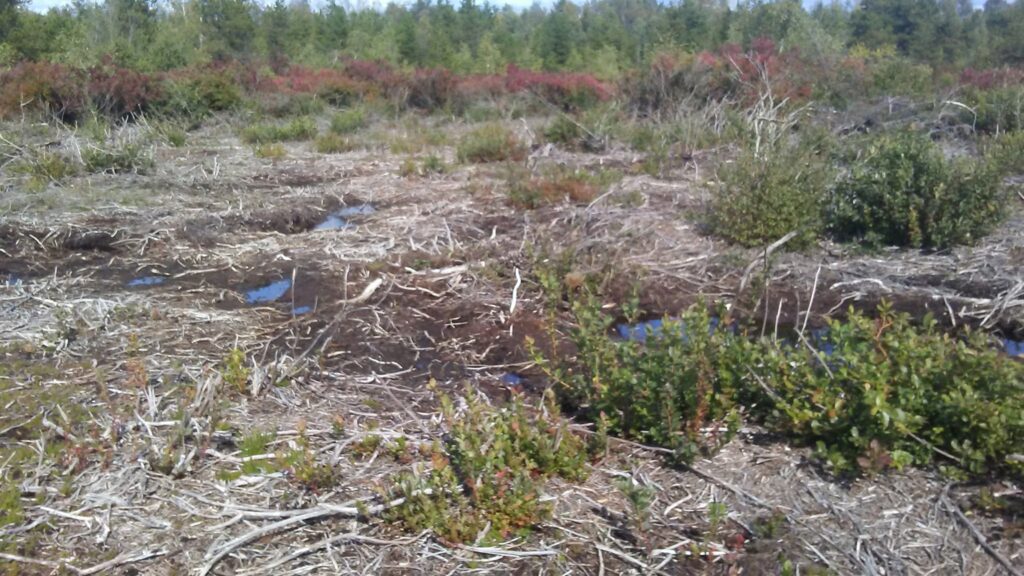
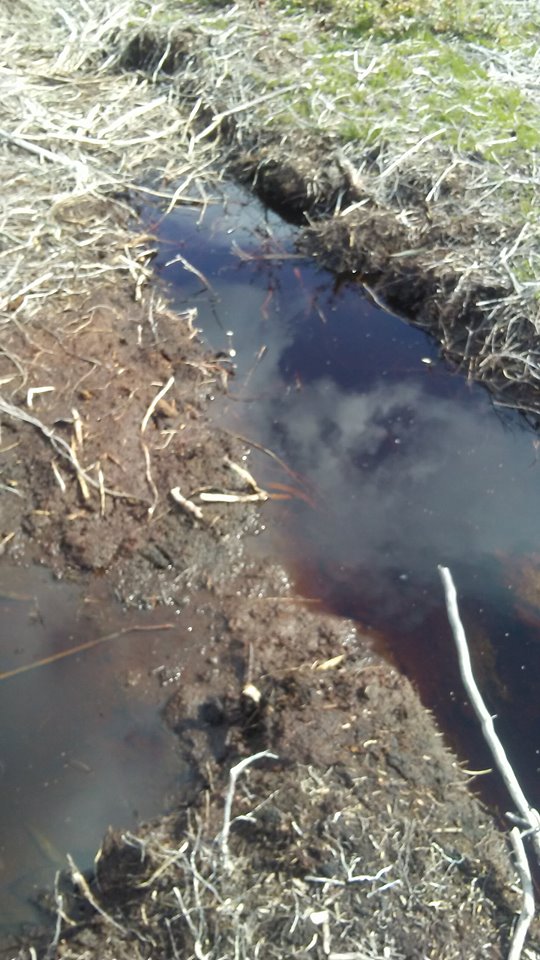
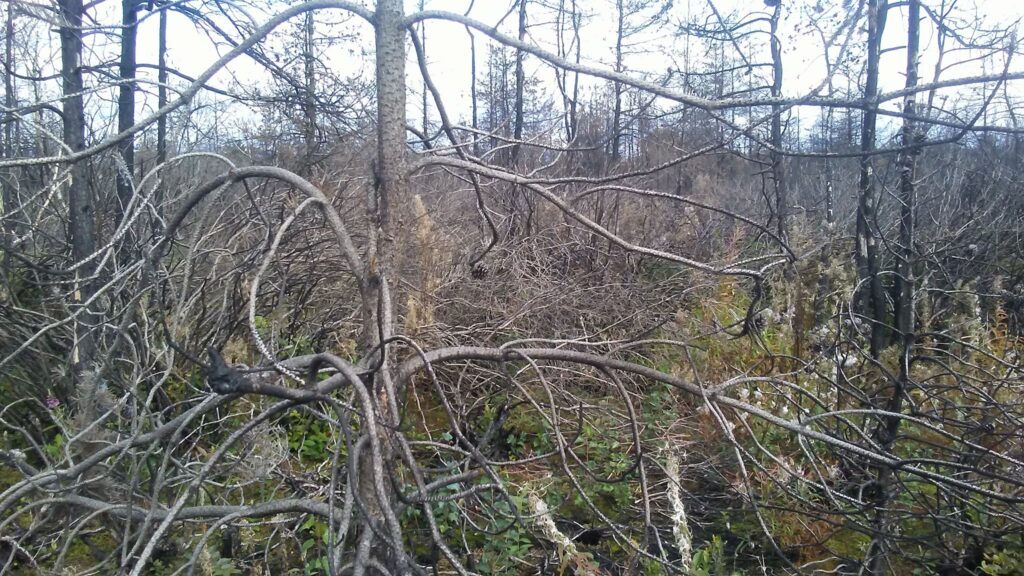
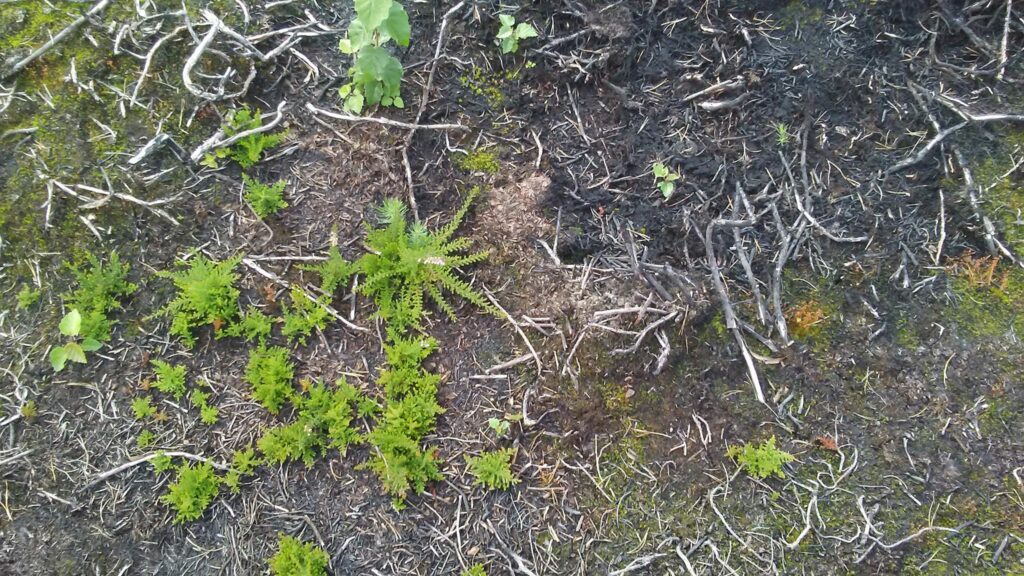
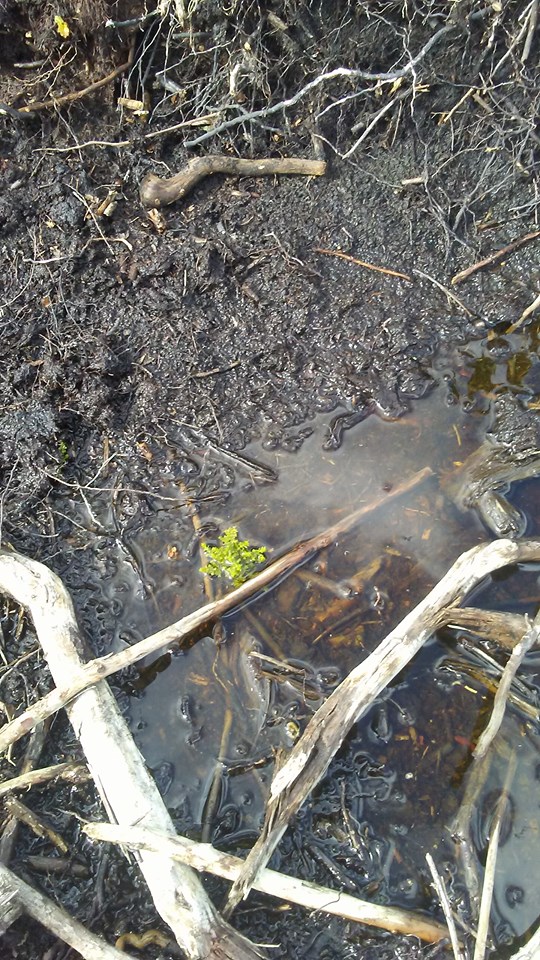
(Above images: images of effects of fire on the bog, as well as what I suspect are most likely tire tracks left by firefighting vehicles. The second images over from the left is of particular interest, because this may be one of the spots where subterranean fire followed a root to the surface, where it likely ignited surface fires.)

Of interest to me, about this site, is the fact that it contains some of the last Lulu Island bog-lands; also, the fact that I am able to now observe the state of the bog a year after the bog-fire I had previously observed in 2018; and, lastly, the fact that the bog is most likely experiencing changes in floral composition due to the introduction of two new European species.

For these reasons, I would like to explore a few interrelated questions:

1) Has the introduction of C. vulgaris led to an increased build up in flammable material in this area?

2) Is the bog being artificially drained, and what effect, if any, is this having on C. vulgaris populations, and the native vegetation?

3) How does C. vulgaris respond to fire?

4) How does the native bog vegetation respond to fire?

The first two questions may be more difficult to ascertain answers to. However, I might be able to deduce hypothetical answers from forensic observations of dead and burned vegetation for question one. Question two may require doing research or conducting interviews with civil engineers in Richmond. The last two questions, on the other hand, may indeed provide testable questions that could provide the basis for an experimental design that focuses on the comparison of alien versus native pioneer species fitness in different locations with variations in the degree of fire damage.

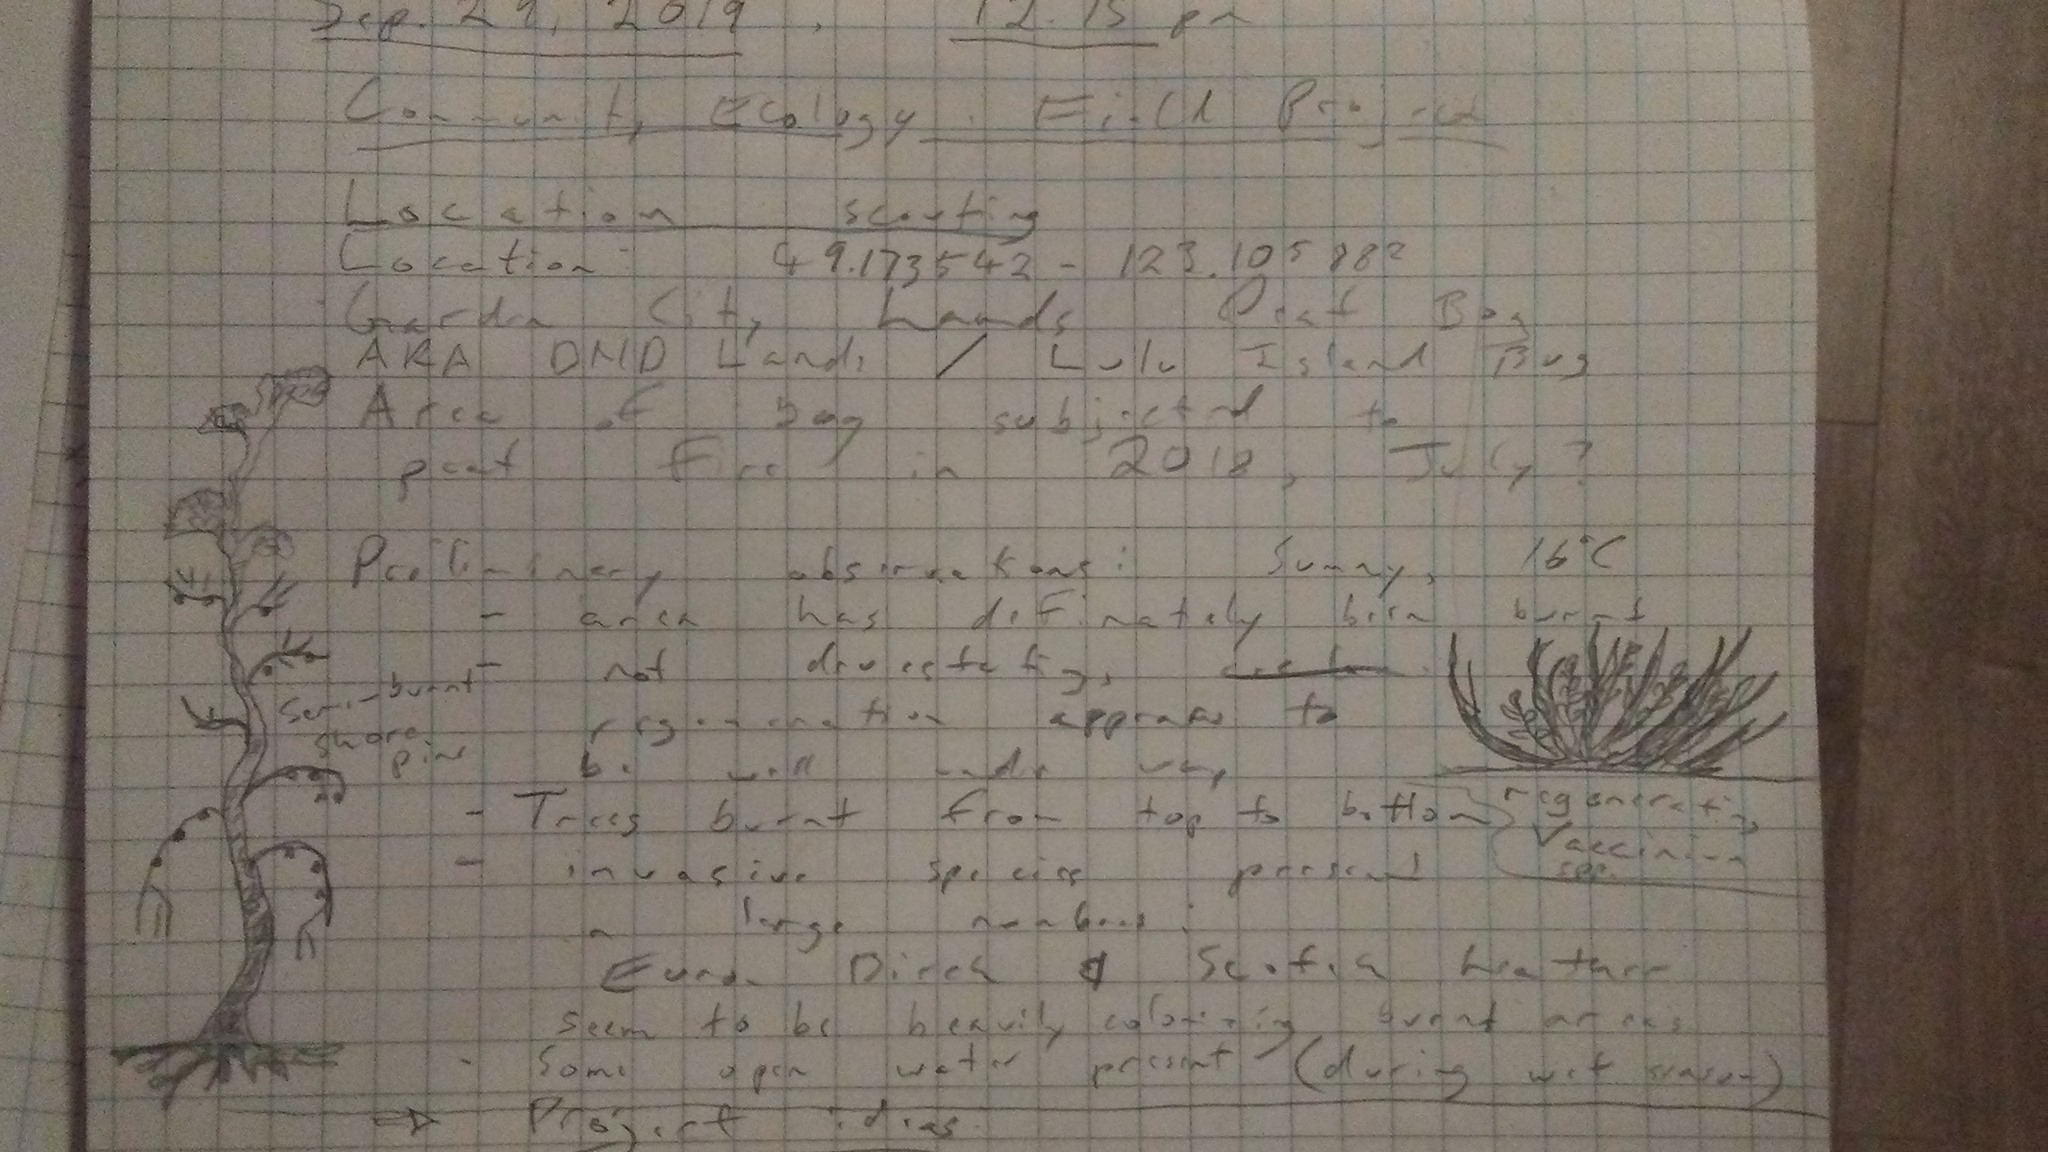
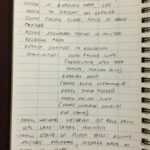
(Above image: field notes of my observations for Sep. 29, at Lulu Island Bog/ DND Lands.)

Citations:

1-4 In Klinkenberg, Brian. (Editor) 2019. E-Flora BC: Electronic Atlas of the Plants of British Columbia [eflora.bc.ca]. Lab for Advanced Spatial Analysis, Department of Geography, University of British Columbia, Vancouver. [Accessed: 02/10/2019 9:14:33 PM

Blog Post 6: Data Collection at Whispering Woods

User:  | Open Learning Faculty Member: 


On October 2nd between 15:47 and 16:27 I collected field data at Whispering Woods park, Calgary AB. The weather was a sunny 7°C with a light breeze. I took 10 replicates of P. tremuloides (aspen tree) from the bottom of the hill, and 10 from the top of the hill. I used a simple random sampling design to find these replicates. A random number generator was used to locate initial tree, then random number generator was used for subsequent replicates by counting the number of trees based on the random number. I walked from West to East and then back again when I reached the last tree on each side. This is a modification from my previous systematic sampling design. I believe is this new method is an improvement, as it allows me to take 10 replicates instead of 9 and uses a more random process.

This was the second day of snow melting since a large snowfall over the weekend, thus I anticipated having difficulties using my soil moisture probe. I predicted the forest floor to be too wet that the probe wouldn’t be able to record an accurate moisture level, or that the snow would skew all my data. However, it appeared that any leftover snow was sitting on the thick layer of native grasses, such that I only had to brush this snow away to isolate the untouched soil underneath. Thus, soil readings were no trouble. Other than this, I had no problems implementing my sampling design.

So far, the patterns observed have been mostly in favour of my predictions. At the bottom of the hill, the mean soil moisture has been higher at the base of the trees, the mean pH has been more neutral, and the mean percentage of yellow leaves, and leaves lost has been lower. Upon reflection, this appears to suggest that the soil conditions are more moist at the bottom of the hill, which serves as a proxy for tree health.

I look forward to collecting more data over the next few weeks to track these patterns further.

Madeleine Browne

Blog Post 2: Sources of Scientific Information

User:  | Open Learning Faculty Member: 


a) The ecological source of information I have found is as follows: Kahn, AS, JWF Chu, and SP Leys. “Trophic Ecology of Glass Sponge Reefs in the Strait of Georgia, British Columbia.” Scientific Reports, vol. 8, no. 1, 2018, pp. 756-11. This source was found on the library website.

b) This article is a research, peer-reviewed, academic source

c) This article is a research article as it outlines a typical research article format (ie. Abstract, introduction, methods, results, discussion), has a descriptive title, the authors of the article (researchers) are associated with a university/institute (as seen by the citation besides their names) and it includes data from their findings. It is an academic source as it is published in an academic journal and including references to supporting research and has in-text citations. The article is peer reviewed as the revision and publication dates are noted.

Blog Post 1: Observations

User:  | Open Learning Faculty Member: 


Initial observations:

The area I have chosen to observe is a small forest area in North Saanich, B.C. There is a trail that connects two suburban roads and a covered forest area to the right of it. I visited the site on September 21. 2019 at approximately 12:10pm. The temperature outside was 16 degrees C with complete cloud cover and no sign of recent rain. The northern side (I believe I will double check coordinates on my next visit) of the trail begins off of a suburban road and the entrance is covered by trees but while walking opens up with the forest on one side and a small area of farm land on the other. The trail opens on the southern side at another suburban road. I noticed while walking that the soil and vegetation that grows changes greatly this is most likely due to the trees that cover the beginning of the trail. The vegetation on the north side of the trail was low to the ground and dense while the vegetation on the south side of the trail was more grass-like and drier with the ground and soil being dry as well.

When entering the forest area I noted a “wildlife tree” with a sign labelling it as such. This tree had a very different appearance to the trees around it. The bark had been worn away, it was much shorter, and it had small holes all over it (from birds and insects? unsure of what type). In the forest area I noted two black slugs (most likely Arion ater L.) and one yellow spotted slug (most likely Ariolimax columbianus). I also noticed that most of the forest floor was covered in a vine-like plant, as well as some going up a few of the tree trunks, covering some smaller tree stumps that had been either cut down or fallen over and completely covering two fallen trees. I was curious as to the plants preference for where it grows- if it has a preference for dead vs alive trees. A few mosquitos were also noted!

some initial questions from my visit are:

  1. why was the “wildlife tree” showing signs of animals/insect preference when no other trees around had similar markings? what caused this? also interesting to note this tree was at the very beginning of the trail and visible from the road side- why would animals have a preference for a tree closer to human habitats.
  2. How does branch cover affect the soil and the vegetation that grows there? how light exposure affects plant growth.
  3. The pattern of the growth of the vine vegetation was of interest to me and I am curious if the conditions to which the plant is growing affects it, is it getting nutrients from the decomposing trees? I will see if I can find roots without harming the vegetation.  

Blog Post 5: Design Reflections

User:  | Open Learning Faculty Member: 


Reflecting upon my data collection, I did have some difficulties. A common, recurring issue that I encountered was human disturbance.  To address this, I moved to a spot approximately 40 km from my home, located at the confluence of the Peace and Halfway Rivers. Eventually this area also became subject to significant recreational and industrial activity.  This ultimately led me to cut my study short (e.g., 9 instead of 10 visits).  Fortunately, I was able to collect a breadth of data.  Looking at the data, it was somewhat surprising to see that certain species tended to be observed each visit but in relatively distinct strata within the overall study area (e.g., riparian area, floodplain, open water).  If my study area had not become as subject to human activity, I would have changed my approach.  I would have used the data that I gathered to pilot a study with a more focused approach both spatially (e.g., larger number of transects in each strata) and temporally (e.g., specific times of day over a shorter period) and probably focused on a single species.  However, the repeated transect data that I collected will serve me well in small scale stratified study of occupancy.  Further, I am still able to include hydrometric data as a variable in the analyses.

BLOG POST 9

User:  | Open Learning Faculty Member: 


I think my question and hypothesis was relatively simple. Although it may have been easy, there were a lot of errors and external variables that were hard to account for when doing the research. I will touch on these in my final report. I did end up changing my hypothesis after speaking with Dr. Baldwin, thankfully I had took in/ wrote down other factors during when I would watch for pollinators. I found creating a hypothesis extremely difficult and looking at such things in nature through that scientific eye very difficult. I think this is because I am a chemistry student and am used to being handed an experiment and finishing it within a lab.

Blog Post 7: Theoretical Perspectives

User:  | Open Learning Faculty Member: 


Blog Post 7: Theoretical Perspectives


September 30, 2019


The theoretical perspective for my field research project came from the positioning of the Hydrocotyle plant. When I was observing the lawn landscape, it seemed as though the Hydrocotyle was only found in the Southern area. The region of the landscape closer to the North side was higher in soil elevation. When I further examined the grassland on the far Southside, I noticed it had a dip in the soil, a region of lower elevation. I presumed more water would collect in this lower elevation area, and the region of higher elevation would receive more sunlight, helping to dry it out. After looking at research and botany articles, I had discovered that this genus is typically known to be aquatic. My assumption was that the soil moisture in the landscape must be over a gradient, which is why the plant would be found in this area of the lawn but not in the far Northside. I decided to test the hypothesis that there was a moisture gradient in the lawn, by purchasing a “Moisture meter” from the garden center. I used the mosituer meter to determine that the area on the Southside of the landscape did indeed have a higher mositure content. The moisture found in this area was drastically higher than on the North side. I checked the moisture levels on 3 different days. On average the South area ranged from ‘10’ (farthest Southside) to ‘4’ (on the Northern side). The moisture levels varied on the 3 days which I observed them, but all showed the South side having a high moisture level of ‘10’. I decided to test the theory that Hydrocotyle was limited by the moisture.


My research project touches on the ecological process of plant limitations on soils moisture levels. As I observed 6 different species in the lawn, the project also touches on diversity of plants in areas of high soils moisture levels vs. low moisture levels. I found more varieties of plants in the areas of high moisture level. The paper would also include the ecological process of reproduction and plant growth under soil moisture. Three key words I would use for the research paper are “soil moisture,” “grassland gradient,” and “Hydrocotyle limitations.”


Blog Post 2: Sources of Scientific Information

User:  | Open Learning Faculty Member: 


The article titled “Ten-year regeneration responses to varying levels of overstory retention in two productive southern British Columbia ecosystems” was sourced from the TRU Library and is available through Science Direct at the following link (Newsome et al. 2010):

https://www-sciencedirect-com.ezproxy.tru.ca/science/article/pii/S0378112710002057?via%3Dihub

The article is classified as an academic, peer-reviewed research material. The article is classified as academic because the authors are considered experts in the field (i.e., governmental and university), and there is in-text citation and a bibliography. The article is classified as peer-reviewed and it states the article history as received on 6 February 2010, received in revised form 6 April 2010, Accepted 7 April 2010. This article history means there was an opportunity for the article to be rejected, therefore the article has been peer-reviewed. The article is classified as research material as there is a methods and results section, where the article reports on results of the study.

Reference:

Newsome T, Heineman J, Nemec A, Comeau P, Arsenault A, Waterhouse M. 2010. Ten-year regeneration responses to varying levels of overstory retention in two productive southern British Columbia ecosystems. Forest Ecology and Management [Internet]. [cited September 29, 2019]; 260: 132-145. Available from: https://www-sciencedirect-com.ezproxy.tru.ca/science/article/pii/S0378112710002057?via%3Dihub . doi:10.1016/j.foreco.2010.04.012

Blog Post 1: Observations

User:  | Open Learning Faculty Member: 


The location I have selected for my field research project is Cosens Bay in Kalamalka Lake Provincial Park, Vernon BC (50011’44” N, 1190 15’40” W) (Figure 1). There is a hiking trail that extends approximately 2.5 km from the car park west, downslope towards Kalamalka Lake. On September 25, 2019 between 17:20 and 18:45 it was 15 degrees Celsius and cloudy. Several ecological communities are present (including forest, grassland and riparian communities) within the Cosens Bay area, of which are associated with the following features: the riparian area of Kalamalka Lake, adjacent wetland, open disturbed grassland, gulley features, south facing slope with an open canopy and a north facing slope. Given the environmental gradient at the site there are several differences in ecological communities to observe.

Figure 1. View of Cosens Bay Hiking Trail and different ecological communities.

The riparian area of Kalamalka Lake (approximately 400 m above sea level (asl)) consists of a vegetated area approximately 20 m wide and 330 m long with black cottonwood (Populus trichocarpa), interior Douglas fir (Pseudotsuga menziesii) and a stand of trembling Aspen (Populus tremuloides) trees (Photo 1). Several dead black cottonwood trees are wildlife trees with cavities suitable for nesting avian species. Shrub species along the riparian area consist of black hawthorn (Crataegus douglasii), common snowberry (Symphoricarpos albus), Douglas maple (Acer glabrum), tall Oregon grape (Mahonia aquifolium), Saskatoon (Amelanchier alnifolia), rose species (Rosa spp.), poison ivy (Toxicodendron radicans), wild asparagus (Asparagus officinalis) and horsetail species (Equisetum spp.).

Photo 1. View looking south west towards Kalamalka Lake illustrating the vegetated riparian area.

Behind the black cottonwood riparian band is a wetland feature approximately 75 m wide and 170 m long (at similar elevation of 400 m asl) with common cattail (Typha latifolia) dominating the wetted perimeter of the wetland (Photo 2). Other shrub species surrounding the wetland include the aforementioned species.

Photo 2. View looking south east towards wetland feature and area of common cattails.

North of the riparian area is a south facing slope extending up to 700 m asl dominated by ponderosa pine (Pinus ponderosa) with some interior Douglas fir trees (Photo 3). The tree canopy is relatively sparse as the elevation increases to 700 m asl with an understorey dominated by bluebunch wheatgrass (Pseudoroegneria spicata). Areas of exposed rock are present indicating shallow soils.

Photo 3. View looking north illustrating the south facing slope, exposed rock and open canopy.

An open valley is between the south facing slope, and a north facing slope. The open valley appears disturbed with a high occurrence of invasive species including knapweed species (Centaurea), mullein (Verbascum thapsus), thistle species (Cirsium spp.), sulfur cinquefoil (Potentilla recta), white sweet clover (Melilotus albus) and chicory species (Cichorium spp.) (Photo 4). Native species within the open valley included thickets of common snowberry and Saskatoon. The north facing slope is more gradual relative to the south facing slope and consists of a dense interior Douglas fir forest (Photo 5).

Photo 4. View looking east illustrating the open, disturbed valley with shrub thickets.

Photo 5. View looking south towards the north facing slope dominated by interior Douglas fir trees.

Wildlife observed within the riparian area included birds of prey. A chorus frog was heard adjacent to the wetland area and signs of deer were observed within the open valley. No other wildlife was observed, however the area would likely be used by other song birds and ungulate species.

On review of the different ecological communities, I observed more common snowberry present in the riparian area, surrounding wetland area, and moisture receiving areas within the open valley community. Common snowberry was less dense when the ecological community transitioned to a steeper, south facing slope. In areas where rock was exposed and the understorey was dominated by bluebunch wheatgrass there was little to no common snowberry present.

On review of the ecological communities, the following questions are presented:

  1. Is common snowberry present in moisture receiving areas only?
  2. Is common snowberry more dense in riparian areas?
  3. How drought tolerant is common snowberry?
  4. Is common snowberry important foliage for wildlife in fall and winter?
  5. Does the presence of common snowberry influence the occurrence of wildlife in fall and winter?
  6. Can understanding common snowberry and associated species influence riparian restoration and enhancement to improve water quality and overall watershed management?
  7. Is the riparian area ecological community Red or Blue listed in BC and how does this influence management decisions?

Field notes from September 25, 2019 are attached below.


Blog Post 5: Design Reflections of Whispering Woods

User:  | Open Learning Faculty Member: 


I collected my initial data on September 23, 2019; most of the collecting went smoothly and as planned, but during the collection and upon reflection some of it requires modification.

One of these difficulties was my sampling strategy. I had planned on using a systematic sampling strategy (explained in my Small Assignment 1) where I would use a random number generator to indicate which initial tree I would sample (at the very top and bottom row of trees on the hill). From there, I would count 9 trees, and 18 trees to the left and right of the initial sample to collect a total of 5 replicates. I realized while I was there; however, that if the randomly generated number was very small or very large, there may not be enough trees on one side of that tree to collect the second and third sample. I decided I would instead count another 9 (or 18, if necessary) trees after the 18th tree on the other side, to make up for this. I am having difficulties determining if this modified method of systematic sampling is “random” enough, yet I can’t think of an alternative.

With regards to the actual data I collected, the mean soil moisture levels at the bottom and top of the hill followed my prediction (the bottom of the hill having a higher mean moisture level). My leaf class strategy (class 1 being trees with 0-5% yellow leaves, class 6 being trees with 95-100% yellow leaves) will likely become more useful as the Fall progresses, as the vast majority of trees at the top and bottom of the hill all fell under the class 1 category. As well, the soil pH readings were very similar at both locations along the elevation gradient, not providing any useful measurements at the moment.

None of this is surprising, as the data I am collecting is likely to change drastically as the Fall progresses. For instance, we are now in our second day of snowfall in Calgary, Alberta, so it should be interesting to study the differences in soil moisture, pH, and leaf colour later this week after a few days of melting. For this reason, I plan to continue the same measurements as in my initial collection to allow for potential changes in pH, soil moisture, and leaf colour to be captured.

However, there are a few modifications to my data collection I would like to make. Firstly, I would like to adapt my data collection to the seasonal progression changes. For instance, as the Fall progresses I will likely add in a leaf loss measurement similar to my leaf class strategy. This way, I can measure the rate of leaf loss on top and bottom hill trees, which will be more applicable than leaf colour at that point. I may add other measurements as well (such as snow depth, to measure water infiltration rate). I also do not want to stick to a specific schedule as to when I collect data. Of course, data collection must be frequent enough to be able to capture changes in the health parameters I’ve mentioned, but I would also like to respond to weather changes. For instance, I will not be collecting data while the location is buried in 1ft of snow, as my pH and moisture meter do not have the capabilities to function in such drastic conditions. Instead I will collect data soon after the snow has melted, to study initial differences among the elevation gradient. Ideally, I would like to collect data no more frequently than every 5 days, but no less frequently than every 10 days (if weather permits).

I believe these modifications will improve my research because they will account for the natural and uncontrollable fluctuations in weather. Modifying the data I will be collecting will allow for my data to stay relevant as the Fall season progresses. Modifying the frequency of data collection will achieve the exact same thing. I hope, through these modifications across time, that I will more holistically be able to capture any differences in tree health among trees located at the bottom and top of Whispering Woods hill.

That’s all for now!

Madeleine Browne