Recent Posts

Post 1: Observations

User:  | Open Learning Faculty Member: 


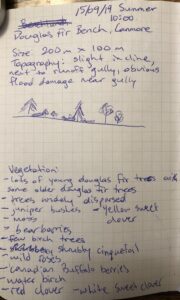
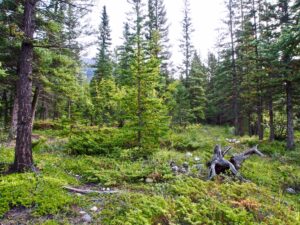
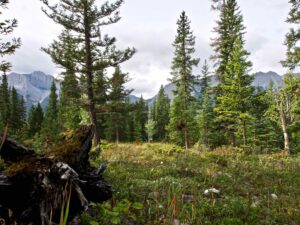
The location I have chosen to study is along the Douglas Fir Bench Trail in Canmore, AB at the foot of Mount Lady MacDonald. It is approximately 50m x 100m. It is next to a rocky, run-off gully; has a slight incline; and is within a douglas fir and birch forest. The forest floor is covered in shrubs such as juniper, bearberry, cinquefoil, clover, and Canadian Buffalo berries.

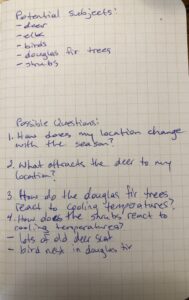
I visited this location on September 15, 2019 at 10:00 am. The weather was cool at 12 celsius and sunny with a few clouds. I noticed elk and deer scat throughout the area suggesting it is visited by such animals. There was what appeared to be a bird’s nest atop of one of the fir trees. Potential subjects of study for the area could be deer, elk, and douglas fir trees.

A few initial questions include: how do the douglas fir trees react to the cooling temperatures as the season changes; how do the shrubs react to the cooling temperatures as seasons change; and what attracts the deer and elk to the area?

Blog Post 2: Sources of Scientific Information

User:  | Open Learning Faculty Member: 


My chosen source of ecological information is the article “The vegetation, surface water chemistry, and peat chemistry of moderate-rich fens in central Alberta, Canada” published 1989 by Wai-Lin Chee and Dale Vitt.

This article can be found online at: https://www.researchgate.net/publication/225684988_The_vegatation_surface_water_chemistry_and_peat_chemistry_of_moderate-rich_fens_in_central_Alberta_Canada.

This piece of literature would be classified as academic, peer-reviewed research material.  I classified it as such for five reasons. Firstly, this is an academic paper because the authors of it are “experts in the field”, as both of them are affiliated with the University of Alberta. As well, the paper contains numerous in-text citations citing other scientific journals, and contains a Bibliography. This research can also be classified as peer-reviewed. While it doesn’t explicitly mention acknowledgment of a reviewer, the journal Wetlands, under which it was published, is peer-reviewed. This was stated in the website that can be found here: https://www.sws.org/Publications/wetlands-journal.html. Finally, this paper is research material, as the authors conducted a field study themselves. The Methods and Results of this research is included in the article. 

Post 9

User:  | Open Learning Faculty Member: 


Moving forward, I would review some of the literature prior to designing another experiment.  As noted in an earlier post, if I had a deeper understanding of the evolutionary fitness of my response variable I would have chosen different replicates to study.  Although the results of my study were much subtler than what I had predicted, I have gained an appreciation for natural history and the importance of ecological theory before engaging in applied or industrial ecology.

Post 9: Field Research Reflections

User:  | Open Learning Faculty Member: 


Designing a field study was an interesting way to identify patterns in nature, and then use theoretical concepts from the textbook to explain my observations. The greatest challenge I faced was designing a study that fit within my time and equipment constraints that could test my hypothesis. From my initial observations, I hypothesized a positive relationship between Canada goldenrod height and level of sunlight exposure. However, I soon realized that height of the goldenrod plant involved too many confounding variables, since I could not determine when the plants began growing. Furthermore, due to my time constraint, I would not be able to measure any significant growth over a period of time. As such, I revised my hypothesis and study design to measure plant density, which I assumed would be affected similarly by sunlight. Designing my study was straight forward, however, implementing it into the field was relatively challenging. The quadrat sampling method was the best method to collect my data, but it was time consuming to accurately pinpoint the randomly generated coordinates within my study area. Additionally, I had to navigate my study area in a way to least disrupt the surrounding vegetation.

Designing and implementing my own field study has given me a greater appreciation for ecological theorists. Collecting reliable data is extremely tedious and an iterative process. Furthermore, when dealing with nature there are many confounding factors that to be considered. I can only imagine the amount of work that must go into designing an irrefutable ecological theory!

Post 8: Tables and Graphs

User:  | Open Learning Faculty Member: 


I presented my data summarizing the relationship between mean Canada goldenrod density and level of sunlight exposure in a bar graph. I graphed the mean density (number of plants/m2) as a function of the site along the ecological gradient (low, moderate, and high sunlight). This method allowed me to represent the average value from the 10 quadrats in each stratum, as well as include an error bar to indicate the variance (SE). Additionally, I was able to include the results from my one-way ANOVA and post-hoc Tukey’s HSD test within the figure, by indicating significantly different results with different letters above the bars. The only challenge I had when summarizing my data was converting all density values to a per m2 basis. The data I collected represented the number of plants in a 0.25m2 quadrat. However, I thought presenting it as a more common measurement of number of plants per m2 would be easier to interpret on a graph. As such, I had to convert all of my data accordingly and ensure that my statistical analysis and SE values utilized the same values. 

My initial hypothesis was that density would increase with level of sunlight exposure. While my data revealed a significant difference between the mean densities at low and moderate sunlight exposure, there was no significant difference between the mean densities at moderate and high sunlight exposure. This led me to consider the possibility that there is a maximum density that can be supported within a given environment as a result of intraspecific competition. After completing my literature review, I discovered that Canada goldenrod is a very invasive species and exhibits allelopathic effects on neighbouring vegetation. As such, I am curious whether individual goldenrod plants may exhibit intraspecific allelopathy, which limits their density under optimal growing conditions. Furthermore, while the plants in the high sunlight exposure stratum appeared to have a higher density than plants in the moderate sunlight stratum, I found that this was largely due to more growth in terms of height, leaves, and flowering. Therefore, the influence of sunlight on other metrics of plant success presents an interesting topic of study.

Blog Post 8: Tables and Graph

User:  | Open Learning Faculty Member: 


I had no issues organizing my data. I began by creating 6 tables (1 for each site visit) and have the total number of plants found in each Transect and if they were juvenile, mature, or dead plants. Once I had this information down in organized tables it was much easier to create bar graphs of our findings. I have attached 1 table and a graphical representation of all 6 site visits and their findings. I was surprised of my findings in transects 4-6 during site visits 1-3. This is because Heracleum mantegazzianum is a very strong plant and can handle all sorts of conditions, hense why it has been so successful as an invasive species in North America. But as this is the furthest North it has began to reach in British Columbia, the chances are it just has not made it to the denser forest and higher altitudes at this time. 

Transect  Juvenil  Mature  Dead 
T1  0  1  0 
T2  3  0  2 
T3  6  0  4 
T4  0  0  0 
T5  0  0  0 
T6  0  0  0 
Total Mean  1.5  0.2  1 

(Table 1 – results of plants found on May 25th, 2019. Transect 1-3 are within Section 1 (disturbed sites) and Transects 4-6 are within Section 2 (natural site)).


Post 7: Theoretical Perspectives

User:  | Open Learning Faculty Member: 


My study examines the effect of sunlight exposure on density of Canada goldenrod (Solidago canadensis). I hypothesized that higher levels of light exposure would be better growing conditions for the goldenrod, and therefore would result in increased plant density. As such, my research primarily relates to the goldenrod’s germination process and its preferential growing conditions. Additional factors that will be considered are the effects of soil moisture, elevation, and competition with other vegetation.

Three Keywords: Sunlight exposure, plant density, Solidago canadensis

Post 6: Data Collection

User:  | Open Learning Faculty Member: 


I did not make any changes to my stratified random sampling method from Module 3, however, I decided to increase the number of replicates from five to 10 for each stratum, as I observed variation within each stratum that could be reduced with a greater number of samples. I continued to use a distance-based sampling method with the random number generator to create two numbers, an angle and a distance in cm to determine the location of the sample unit to measure. I did not encounter any other problems since revising the data collection technique mentioned in Blog Post 5. A potential ancillary pattern I noticed was that the stratum with a high level of exposure to sunlight, which appeared to consist of the tallest plants, was also the furthest away from the creek, with the highest elevation. The moderate exposure strata was second closest, and the low exposure strata was adjacent to the creek. This prompted me to consider the effect of soil moisture and elevation as potential confounding factors affecting plant growth.


Edit:

I collected my data again following my revised hypothesis and study design outlined in Blog Post 5. I implemented the stratified random sampling method using quadrats to measure density of the Canada goldenrod. While this method was more difficult that simply measuring the height of individual plants, I believe it will provide more conclusive results of the effect of sunlight exposure on plant success. This sampling method was more time consuming, but included a larger sample size. I sampled 30 replicates in total, 10 from each strata. Potential ancillary patterns are similar to those observed with height measurements, since density and height appear to be correlated.

Post 5: Design Reflections

User:  | Open Learning Faculty Member: 


While implementing my sampling strategy, some difficulties arose when deciding how to ensure randomization when selecting which sample units to measure. I needed to find a sampling method that allowed me to randomly choose a plant by assigning numerical values to put into a random number generator. I originally wanted to divide each strata into a grid of coordinates, but found out quickly that this was not feasible. I found it difficult to make a grid small enough that each box contained only one stem, therefore, I ended up using the distance-based method. I then found that as I was measuring the distances to the selected point, the plants were not fixed in space and so it was difficult to accurately select the correct plant. I then decided to place the measuring tape on the ground and measure to the bottom of the stem to ensure accuracy. 

I found some of the data collected to be surprising, especially in the low degree of sunlight exposure strata. What surprised me was the degree of variation within these strata, especially that of the low degree strata. In this area, most of the plants were under 90 cm tall but there were a few that reached almost 110 cm. Because of this, I decided that five replicates was not enough data to accurately represent the population in each strata. I plan to continue to use the distance-based sampling method with the random number generator, but will generate more replicates so that I have a total of 10 sample unit measurements in total for each strata. I think that increasing the sample size will better represent the sample and decreases the variance within each strata. 


Edit:

I decided to revise my research study, and focus on density of the Canada goldenrod as my response variable. I believe density is a better representation for plant growth success, as it eliminates other factors. Height would not be an accurate representation of plant success, unless I measured plant growth over a period of time. Due to the time constraints of my study, I would not be able to record meaningful data for differential plant growth among goldenrod plants in the different strata. As such, I have revised my study design and sampling methods to measure goldenrod density at different levels of sunlight exposure. To calculate density, I will use a stratified random quadrat sampling method, using the same strata that I initially identified. I will divide my study area into three 10 m by 10 m strata, representing low, moderate, and high levels of sunlight exposure. I will randomly place 10 quadrats in each strata by using a random number generator to generate two coordinates. I will continue generating coordinates until I have 10 points in each stratum. I will then locate these points on my study plot by placing a measuring tape on the ground and measuring the appropriate point, which will represent the bottom left-hand corner of the quadrat.

Post 4: Sampling Strategies

User:  | Open Learning Faculty Member: 


The technique that is most time-efficient for area sampling is haphazard, with a total time of 12 hours and 29 minutes. Systemic sampling took 12 hours and 36 minutes, and random sampling took 12 hours and 45 minutes.

Eastern Hemlock – Most Common

  • Actual Density: 469.9
  • Systemic Sampling: 524.0; Percentage Error: 11.5%
  • Random: 666.7; Percentage Error: 41.9%
  • Haphazard: 650.0; Percentage Error: 38.3%

 Red Maple

  • Actual Density: 118.9
  • Systemic Sampling: 100.0; Percentage Error: 15.9%
  • Random: 79.2; Percentage Error: 33.4%
  • Haphazard: 112.5; Percentage Error: 5.4%

 White Pine – Most Rare

  • Actual Density: 8.4
  • Systemic Sampling: 12.0; Percentage Error: 42.9%
  • Random: 8.3; Percentage Error: 1.2%
  • Haphazard: 0.0; Percentage Error: 100%

Striped Maple

  • Actual Density: 17.5
  • Systemic Sampling: 12.0; Percentage Error: 31.3%
  • Random: 66.7; Percentage Error: 281.1%
  • Haphazard: 20.8; Percentage Error: 18.9%

Sweet Birch

  • Actual Density: 117.5
  • Systemic Sampling: 136.0; Percentage Error: 15.7%
  • Random: 170.8; Percentage Error: 45.4%
  • Haphazard: 183.3; Percentage Error: 56.0%

Yellow Birch

  • Actual Density: 108.9
  • Systemic Sampling: 128.0; Percentage Error: 17.5%
  • Random: 70.8; Percentage Error: 35.0%
  • Haphazard: 162.5; Percentage Error: 49.2%

Chestnut Oak

  • Actual Density: 87.5
  • Systemic Sampling: 104.0; Percentage Error: 18.9%
  • Random: 54.2; Percentage Error: 38.0%
  • Haphazard: 54.2; Percentage Error: 38.0%

When comparing the two most common species, the most accurate sampling strategy for Eastern Hemlock was systemic sampling with a percentage error of 11.5%. The most accurate sampling strategy for Red Maple was haphazard sampling, with a percentage error of 5.4%. If you average the percentage errors of the two species of systemic vs. haphazard sampling, the average error of systemic is 13.7% and haphazard is 21.9%. Therefore, the most accurate sampling strategy is systemic sampling.

When comparing the two most rare species, the most accurate sampling strategy for White Pine was random sampling with a percentage error of 1.2%. The most accurate strategy for the Striped Maple was haphazard sampling with a percentage error of 18.9%. Comparing the averages of the percentage errors for these two strategies, the most accurate sampling strategy is haphazard with an average percentage error of 59.5%. The average percentage error of random sampling is 141.2%. The accuracy of the sampling appears to decline with rarer species, as evidenced by the increase in the percentage error averages.

 I do not believe that 24 was a sufficient number of sample points. As the density of the tree species varies so greatly throughout the study area, using this number of points resulted in missing some species in the sample that were present. For example, although the density of White Pine trees was 8.4, with haphazard sampling this species was not sampled resulting in a 100% percentage error.