Recent Posts

Blog Post 2: Sources of Scientific Information

User:  | Open Learning Faculty Member: 


The paper I have chosen is titled  “Effects of Bark Beetle-Caused Tree Mortality on Wildlife”. I have identified it as an academic peer-reviewed research paper as it satisfies the following criteria:

The paper is written by Jefferey A. Hicke, an associate professor at the University of Idaho, who specializes in climate change, global environmental change, and Forest disturbance research. The paper is also supplemented by research from the Pacific Wildland Fire Sciences Laboratory and the Pacific Southwest Research Station. There are various in-text citations throughout the article and a bibliography found on pages 9-10. Referee’s are mentioned in the Acknowledgements section but are not credited by name. The Author clearly states a methods section followed by a discussion on the results.

Reference:

Hicke, Jefferey A., et. all. “Effects of Bark Beetle-Caused Tree Mortality on Wildlife.” Forest and Ecology Management. Science Direct. Feb 1 2012. pp 82-90. https://www.firescience.gov/projects/06-2-1-20/supdocs/06-2-1-20_Effects_of_bark_beetle-caused_tree_mortality_on_wildfire.pdf

Blog Post 5: Design Reflections

User:  | Open Learning Faculty Member: 


I had two main difficulties when establishing the sampling of my research area. The first issue was establishing quadrats of equal size due to the terrain. I initially wasn’t sure how I was going to measure out this distance given the uneven terrain and thick tree cover. However, I decided that using a string pre-measured at 20m worked better than trying to navigate through the forest with a tape measure. Using this method I did manage to space out several 400m2 quadrats and will create more to further my research. Using this method I found it easy to search for my response variable (presence of bracket fungi on trees) and will continue to with this method.

The second significantly bigger challenge that occurred was the annual spring break up of the river which flooded out a large section of my study area. I initially established my quadrats starting from the bridge and ending near the high school. However, about a 500m stretch of park was entirely flooded due to record-high water levels. I therefore had to adjust my study area slightly and anticipate being unable to establish quadrats in the flooded areas. This was a shame because I had visualized bracket fungi on a few of the trees in these now flooded areas but did not get a chance to study them before the water level rose. It is unlikely I will be able to access these areas again for the duration of the course.

For my sampling method I opted to use the quadrat method, using the Kiwanis trail as a makeshift transect. This allowed me to study areas on both sides of the trail, which vary a fair bit in terms of species abundance and moisture content. However, at present, most areas on the east side of the trail (closer to the river) are inaccessible, therefore for my initial study, I only included counts from quadrats on the west side of the trail which weren’t waterlogged. I suspect the water in the east areas will recede within the coming weeks so I may be able to resume sampling in these areas later. However, if the water level does not recede, then I will adjust my study method and create a transect west of the trail rather than studying quadrats on the east side that may continue to be inaccessible. The key downside of this modification to my research methods is that it cuts out the trees nearer the river that sit on a steeper slope and are subjected to different environmental conditions to those trees inland. I was hoping to see if any key differences could be found between trees based on their proximity to the river

On a final note, I am still struggling to determine what to study for the predictor variable(s) and how to go about measuring them.

Blog Post 8: Tables and Graphs

User:  | Open Learning Faculty Member: 


At this point, I have completed the collection of all my data. In the Small Assignment #5, I have made some graphs using the data I collected from the field (garden) for this experiment.

My graph demonstrates the relationship between the number of other types of plants growing in 30 cm from each bean plant (sample plant), and each individual plant’s growth estimated using its leaf and bean pod numbers. Each graph is a representation of sample data from one garden bed. While summarizing my data, I did not have any major difficulties, but it rather helped me to see if really there was a correlation between both the independent and dependent variables. It also helped me to eliminate one row of data recorded from when I collected data, in which all numbers were 0, except for only one sample, in which there were 6 flowers per bean plant.

Referring back to my hypothesis, which involved determining whether the presence of other plant species growing near an individual bean (Phaseolus vulgarus) plant contributes to its growth and abundance. When I did the experiment, I was looking forward to understanding whether greater diversity in garden plots would reduce the intraspecific competitions; therefore, leading to larger bean plants. However, the results obtained from the experiment, were unexpected, as I anticipated a positive relationship between the growth of the bean plant, and diversity of plants near it. Some of the results indicates a negative correlation, others weak positive correlation, and the rest show no correlation. This opened my mind to further explore the effect of greater diversity of plants in the same garden bed, or in a close area. I also want to explore the effects of interspecific as well as intraspecific competition. I wonder if either ever favours the growth of bean plants, or if there are perhaps other confounding variables that might be leading to the bean growth and abundance. Finally, I am looking forward to comparing my research results with other results from literature, as I continue to write my report.

Percy Herbert, Blog Post 4: Sampling Strategies

User:  | Open Learning Faculty Member: 


The three sampling techniques used in the virtual forest tutorial were haphazard, random, and systematic. There are advantages and disadvantages to each of the three sampling techniques. For each of the techniques 25 area quadrats were observed. For haphazard sampling 5 quadrats were selected from each of the 5 topographical regions by trying to hand select quadrats representative of the average tree density in each region. For random sampling a random list of 25 coordinates were generated and those quadrats were observed. For systematic sampling a transect which crossed the entire sampling area, passing through all topographical regions was used. Quadrats were observed on alternating sides of the transect.

The quickest sampling method was systematic sampling at 12 hours and 36 minutes. This makes sense as there is little time spent walking between quadrats as they are all located in a linear line. Haphazard (13 hours 2 minutes) and random (13 hours 13 minutes) sampling both took longer than systematic sampling due to the distance between observed quadrats.

Systematic sampling was the most accurate sampling method for the 2 most common tree species (Eastern Hemlock and Red Maple). Systematic sampling had an error of 5% for Eastern Hemlock  density and 25% for Red Maple density, both lower than haphazard (14% and 51% error respectively) and random sampling (17% and 32% respectively). This result is expected as systematic sampling forces the observer to follow a preset system during sampling eliminating the possibility of the observer biasing the samples as can occur during haphazard sampling. Systematic sampling is also a more accurate predictor of the frequency of the two most abundant tree species then random sampling as 5 quadrats are selected from each topographical area. Random sampling allows for quadrats to be selected from any topographical region without any constraints on topographical regions.

Accuracy was better for all 3 sampling techniques for the higher abundance species then for the lower abundance species. Error for the density of the two least abundant species (Striped Maple and White Pine) were 60% and 100% for systematic sampling, 77% and 52% for random sampling, and 31% and 52% for haphazard sampling respectively. A small change in number of individual trees of a certain species can dramatically change the predicted density when the abundance is low. This is understandable as to get accurate results for the low abundance trees, more quadrats would need to be observed.

For predicting densities of tree species in this study it appears that systematic sampling has given the most accurate results. However, even with the use of systematic sampling, more quadrats must be observed if the densities of the lower abundance species are to be accurately predicted.

Blog Post 3 – Ongoing Field Observations

User:  | Open Learning Faculty Member: 


Date: 8 May 2021
Weather: clear, no wind, no precipitation, 10% cloud cover
Temperature: 7°C

I returned to my proposed study area on 8 May 2021 at 0700. The first habitat type I travelled to was the forested area. Immediately I noticed more birds singing than the previous week. I looked at two different locations within the forested portion, and then travelled to the open portion of the study area. I left site at 0759.

Location 1: 10U 439505 / 5425195

This location is in the southwestern portion of the proposed study area. It is dominated by young coast Douglas-fir (Pseudotsuga menziesii var. menziesii) and has a moderate amount of understory consisting mostly of salal (Gaultheria shalon) and sword fern (Polystichum munitum). The canopy closure is approximately 65%. The following bird species were recorded at this location:

  • Townsend’s warbler (Setophaga townsendii)
  • Pacific wren
  • Red-breasted nuthatch (Sitta canadensis)
  • Brown creeper (Certhia americana)
  • Chestnut-backed chickadee
  • Pacific-sloped flycatcher (Empidonax difficilis)
  • Northern flicker (Colaptes auratus)

Location 2: 10U 439671 / 5425085

This location is in the southern portion of the proposed study area. It is similar in vegetation to Location 1, but it is on a steeper slope. The canopy closure is approximately 60%. The following bird species were recorded at this location:

  • Townsend’s warbler
  • American robin (Turdus migratorus)
  • Golden-crowned kinglet (Regulus satrapa)
  • Northern flicker
  • Pacific-sloped flycatcher

Location 3: 10U 439687 / 5425356

This location is in the northwestern portion of the proposed study area. Vegetation is dominated by scotch broom (Cytisus scoparius), with lesser amounts of salal and a few red alder (Alnus rubrus) and vine maple (Acer douglasii) saplings. Although birds were still singing, compared to the forest there appeared to be a lesser amount. The following bird species were recorded at this location:

  • Spotted towhee (Pipilo maculatus)
  • Song sparrow (Melospiza melodia)
  • Dark-eyed junco (Junco hyemalis)
  • White-crowned sparrow (Zonatrichia leucophrys)
  • American robin

My hypothesis is that songbird species richness and abundance is impacted by structural stage of habitat. I predict that songbird species richness and abundance will be higher in the forested portion of the study area rather than the open, shrub-dominated area.

Response variables will be songbird species richness and abundance. The explanatory variable will be structural stage. The response variable would be continuous, while the explanatory variable would be categorical as structural stage is based on a limited number of values.

Blog Post 2: Sources of Scientific Information

User:  | Open Learning Faculty Member: 


The Source:

The source of ecological information that I chose is a recent paper published in the Journal of Ecology called “Quantifying nectar production by flowering plants in urban and rural landscapes”.

Type of Information:

This Source is Academic, Peer-reviewed, Research material.

Support for this Classification:

Academic:
This article is considered academic since the authors are experts in their fields which includes Faculty and a Ph.D. Students from the University of Bristol. All the authors have a high level of education in this field and work in established universities. The Articles also use in-text citation as well as a reference section on pages 1755-1757 which further supports that this article is academic material (Tew et al., 2021).

Peer-reviewed:
This article is peer-reviewed since it was published in a peer-reviewed academic journal called the “Journal of Ecology”. The article also has a section titled “Peer Review” on page 1755 where there is a link to the journal’s website (Tew et al., 2021). On the journal’s website, it states that this article was peer-reviewed by reviewers and by Ignasi Bartomeus with supporting documentation of the review processes that took place before this article was published.

Research:
This article is research material because there is a material and methods section on page 1748 (Tew et al., 2021). This section outlines how the data was collected and the sampling method.

References:

Tew, N. E., Memmott, J., Vaughan, I. P., Bird, S., Stone, G. N., Potts, S. G., & Baldock, K. C. (2021). Quantifying nectar production by flowering plants in urban and rural landscapes. Journal of        Ecology, 109(4), 1747–1757. https://doi.org/10.1111/1365-2745.13598

Blog Post #3: Bracket fungi on trees

User:  | Open Learning Faculty Member: 


I took a couple month hiatus from field work to allow for the snow to melt and for the temperatures to get above freezing, in order to discover organisms I may not have otherwise encountered in winter. I set out on May 6 at 20:00 to the same park I had previously established as my field study site. On my walk I discovered a speckling of trees with bracket fungi (or polypores) growing near their bases. A rough guess would suggest that the prevalence of trees with polypores is about 1 in every 100 trees, including both deciduous and coniferous species. I am curious about what conditions foster the growth of these fungi and if any correlations can be made.


  1. Identify the organism or biological attribute that you plan to study.

Polypore fungi on deciduous and coniferous trees


  1. Use your field journal to document observations of your organism or biological attribute along an environmental gradient. Choose at least three locations along the gradient and observe and record any changes in the distribution, abundance, or character of your object of study.

I encountered five occurrences of trees with polypores.  All but one tree had polypores growing on the east side of their trunk. One tree had fungi growing on the northwest side. All but one were 50cm or less to the base of the trunk. One tree had growths that extended up to breast height. Each tree occurred near other trees (either deciduous or coniferous) that did not contain any fungi. However, the fungi-infected trees seemed to occur in isolation, in the sense that each one was spaced fairly far apart, at least 20 metres or more. None were clustered together from my initial site inspection. Three of the trees were poplar and two were black spruce. All had diameters at breast height (DBH) of at least 20cm.


  1. Think about underlying processes that may cause any patterns that you have observed. Postulate one hypothesis and make one formal prediction based on that hypothesis. Your hypothesis may include the environmental gradient; however, if you come up with a hypothesis that you want to pursue within one part of the gradient or one site, that is acceptable as well.

Process

From initial field inspection, it appeared that the bracket fungi predominantly produced flowering bodies on the east side of the tree trunk on larger trees that were enclosed within a fair amount of canopy cover. This makes me wonder if factors such as sunlight, wind, moisture, tree height and other physical factors affect where the flowering bodies appear.

Hypothesis

The distribution of bracket fungi is determined by tree location within the environmental gradient.

Predictions

  1. Bracket fungi are more likely to develop in well shaded densely populated areas.
  2. Bracket fungi grow on older and taller trees, on both deciduous and coniferous species
  3. Bracket fungi flower on the side of the tree that has reduced exposure to wind.


  1. Based on your hypothesis and prediction, list one potential response variable and one potential explanatory variable and whether they would be categorical or continuous. Use the experimental design tutorial to help you with this.

Potential response variable: occurrence of bracket fungi (Categorical)

Potential explanatory variable: degree of canopy cover (continuous)

This study would be logistic regression because the response variable (presence/absence of bracket fungi) is categorical while the explanatory or predictor variable (degree of canopy cover) is continuous.


Blog Post 2 – Scientific Source

User:  | Open Learning Faculty Member: 


The source:

Stevens, B.S. & Conway, C.J. (2019). Predictive multi-scale occupancy models at range-wide extents: Effects of habitat and human disturbance on distributions of wetland birds. Diversity and Distributions, 26, pg 34-48.

Type of information:

This source is an academic, peer-reviewed research article.

Documentation to support this classification:

This article was written by members of two professional fish and wildlife research units in the University of Idaho (unknown if they are experts) and includes both in-text citations and a full list of references. The article also appears to have been reviewed as it shows to have been received 2018-12-27, revised on 2019-05-31, and accepted on 2019-09-16. Lastly, the article contains both “Methods” and “Results” sections.

Blog Post 2

User:  | Open Learning Faculty Member: 


Verschuyl, J., A. Hansen, D.B. McWethy, R. Sallabanks, and R.L. Hutto. 2008. Is the effect of forest structure on bird diversity modified by forest productivity? Ecological Applications, 18(5):1155-1170.

https://www-jstor-org.ezproxy.tru.ca/stable/pdf/40062219.pdf?refreqid=excelsior%3Ae45ea5077ddaa99c33964d7c2f1828d2

The paper is academic, peer-reviewed research material. The paper contains in-text citations and a bibliography making it academic material. The paper occurs in the Ecological Applications journal which is published by the Ecological Society of America. As per their website, all accepted manuscripts go through the peer-reviewed process (ESA 2021). The paper contains field data which has been analyzed, making it research material rather than review material. A quick google search indicate numerous relevant papers have been written by these authors, demonstrating their expertise in this field.

References:

ESA (Ecological Society of America). Peer Review Process. [accessed 2 May 2021]. https://www.esa.org/publications/peer-review-process-overview/

Blog Post 1

User:  | Open Learning Faculty Member: 


Date of Site Reconnaissance: 2 May 2021
Weather: Partly Cloudy, no precipitation
Temperature: 14 degrees Celsius
Season: Late Spring

A site reconnaissance was completed at the proposed study area which is located immediately west of Ladysmith, BC (Figure 1) on 2 May 2021 from 1345 to 1423.  The area is approximately 0.36 km2, with an elevation range of 115 m to 190 m above sea level (asl), with an average elevation of 145 m asl. The study area overlaps with municipal land and provincial crown land and falls within the Coastal Hemlock very dry maritime (CWHxm) biogeoclimatic zone (Government of BC 2021). The study area is comprised of two general habitat types: second growth coniferous forest and open, tall-shrub habitat. It is bounded to the west by Holland Creek and the Ladysmith water filtration facility, to the north by a rocky ridge, and to the south and east by additional clear-cuts (Figure 2). The study area was derived this way so the two available general habitat types were approximately equal in size.

Figure 1: General Location of Study Area

Figure 2: Study Area

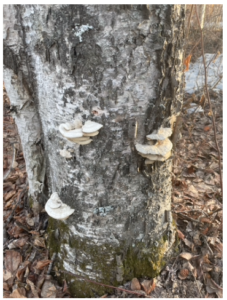
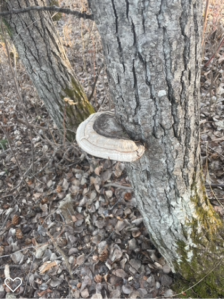
The second growth coniferous forest is dominated by coast Douglas-fir (Pseudotsuga menziesii var. menziesii), with western hemlock (Tsuga heterophylla) and western redcedar (Thuja plicata) being the sub-dominant tree species. The understory is dominated by salal (Gaultheria shallon), with lesser amounts of vine maple (Acer circinatum), oceanspray (Holodiscus discolor var. discolor), and red alder (Alnus rubra) (Photograph 1). The forest is somewhat sloping, with a steeper gradient to the west. This area has a canopy closure of approximately 60 % and a moderate amount of coarse woody debris. The following bird species were recorded in this habitat type during the site reconnaissance:

  • Townsend’s warbler (Setophaga townsendii)
  • Pacific-slope flycatcher (Empidonax difficilis)
  • Pine siskin (Spinus pinus)
  • House finch (Haemorhous mexicanus)
  • Orange-crowned warbler (Leiothlypis celata)
  • American robin (Turdus migratorus)
  • Brown creeper (Certhia americana)
  • Red-breasted nuthatch (Sitta canadensis)

Photograph 1: Example of second-growth coniferous forest portion of study area.

The open tall-shrub habitat falls within a right-of-way for a transmission line as well as an additional cleared space (Photograph 2). Vegetation is largely dominated by scotch broom (Cytisus scoparius), with lesser amounts of sapling vine maple and red alder, and some small patches of salal. A few mature bigleaf maple (Acer macrophyllum) are also present, but generally the area has no canopy closure. The area has minimal coarse woody debris and is generally flat. The following bird species were recorded in this habitat type during the site reconnaissance:

  • Spotted towhee (Pipilo maculatus)
  • Dark-eyed junco (Junco hyemalis)
  • Anna’s hummingbird (Calypte anna)
  • Rufous hummingbird (Selasphorus rufus)
  • American goldfinch (Spinus tristis)
  • American robin
  • Northern flicker (Colaptes auratus)
  • White-crowned sparrow (Zonatrichia leucophrys)
  • Song sparrow (Melospiza melodia)
  • Turkey vulture (Cathartes aura)

Photograph 2: Example of open, tall shrub habitat portion of study area.

Three questions that arose from the site reconnaissance are as follows:

  1. Which habitat type has a higher bird species richness?
  2. Which habitat type has a higher bird abundance?
  3. Do invasive vegetation species have a detrimental effect on local bird populations?


References

Government of BC. 2021. iMap Mapping Tool. [accessed 2 May 2021]. https://maps.gov.bc.ca/ess/hm/imap4m/