Recent Posts

Blog Post 7: Theoretical Perspectives

User:  | Open Learning Faculty Member: 


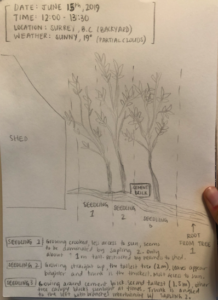
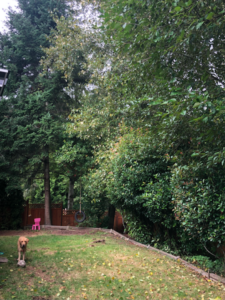
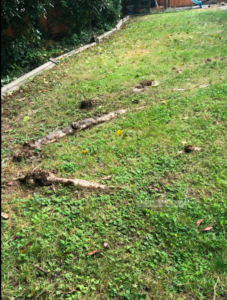
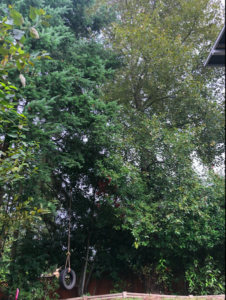
The purpose of my study was to investigate the effectiveness of seedling growth based on exposure to sunlight. Other topics that could be considered in this investigation could include competition over resources between seedlings, and the proximity of neighbouring trees and shrubs that may also create competition for the seedlings. I predicted that increased exposure to sunlight was the cause of Seedling 2’s (the seedling most exposed to sunlight) faster growth rate, and so far the data collected is in support of my initial hypothesis.


Keywords: seedling growth, exposure to sunlight, competition of resources


Blog Post 6: Data Collection

User:  | Open Learning Faculty Member: 


So far data collection has been going smoothly as the plots chosen have provided effective measurements of the amount of sunlight hitting each seedling at the different hour increments of the day. From my observations, each 5″ segment receives sunlight at some point of the day regardless of the shadow casted by my house, the shed, and the adjacent tree canopy, suggesting that the points chosen are able to yield enough data to support the initial hypothesis. I have noticed that the plots that contain Seedling 2 and Seedling 3 receive the most sunlight during the early morning 8:30 AM – 9:30 AM time slot, whereas Seedling 1 only receives sunlight during the mid afternoon 12:30 PM – 13:30 PM time slot. Seedling 2 remains exposed to the sun throughout all three time slots and continues to signs of steady growth as it remains the tallest in height with its branches continuing to support the most leaves.

Blog Post 5: Design Reflections

User:  | Open Learning Faculty Member: 


Data collection has been going well due to convenient access to the study area. I have been gathering data on the seedlings every Friday in three time intervals to measure amount of sunlight. Because I am limited to only three specimens for this study, I chose to use haphazard sampling using replicates of marks labeled A,B,C,D,E, spaced 4 inches from each other along  a line following the base of the root connecting each seedling. I collect data in the morning from 8:00 AM – 9:00 AM, then again at 12:30 PM-13:30 PM when the sun is right above the seedlings, then again at 16:30 PM-17:30 PM. The data collected was not surprising as it supports my initial hypothesis that Seedling 2 will receive more sunlight.


Blog Post 8 – Tables and Graphs

User:  | Open Learning Faculty Member: 


I did not have any difficulties summarizing my data in graphical form. I chose to utilize a bar graph and represent the data as mean number of individual clovers per 1 ft2 quadrant as a function of the level of shade present at each location. The bar graph neatly summarized the abundance of clovers at each location gradient. The graph is easily and quickly interpretable, this is why I chose to use a graph and not a table to present my data. When looking at the graph it is easy to see that it supports my original hypothesis that abundance would be highest in the “no-shade” location. The data did not reveal anything unexpected, however I did think that the abundance in the “partial-shade” would be higher. This has inspired me to consider and explore the effect of anthropogenic influences on the clover growth. I believe that the clovers are less abundant in the “partial-shade” location because the anthropogenic influences create competition for the clovers and introduce disturbances.

Blog Post 3: Ongoing observations

User:  | Open Learning Faculty Member: 


I chose to study the three populus thrichocarpa (common name, black cottonwood) seedlings that stemmed from the largest tree. I will be comparing the height and quality of bark and leaf health between all three seedlings. While connected to the same stem, all three seedlings have different surrounding environments that affect access to sunlight. I have observed that the middle seedling (seedling 2) has the thickest trunk and is the highest of all three. Seedling 2 also has the greatest access to sunlight as Seedling 1 and Seedling 3 both have obstructions in the form of canopy created by adjacent larger trees and a tool shed. Seedling 1 and Seedling 3 also have slightly curved trunks and are noticeably shorter than Seedling 2.


Hypothesis: I hypothesize that Seedling 2 will have the most successful growing period.

Prediction: I predict that greater access to sunlight will allow Seedling 2 to grow at a faster rate than the other two seedlings.

Predictor variable will be access to sunlight (continuous) and the response variable will be the growth in height of each seedling.  Explanatory variables could be the nearness to the shed or adjacent trees as these could both impede growth (categorical).

Blog Post 7 – Theoretical Perspectives

User:  | Open Learning Faculty Member: 


My study investigates the abundance and distribution of Trifolium repens across a community park. I hypothesized that the less shaded the environment the better growing conditions would be for the clovers, and therefore would lead to a higher abundance. My study location is a community field so anthropogenic influences may affect the abundance of clovers, in particular in the “shaded” and “partial-shade” plots. Also because of the anthropogenic influences, in some plots competition has been introduced.

Keywords that I could use to describe my research project are; clover growth, abundance and anthropogenic influences.

Blog Post 2: Sources of Scientific Information

User:  | Open Learning Faculty Member: 


I chose an online article titled “Hydroclimatic drivers of the growth of riparian cottonwoods at the prairie margin: River flows, river regulation,, and the Pacific Decadal Oscillation” written collectively by Laurens J. Philipsen et al. This article was published in the month of October 2018 through the Dendrochronologia journal which is an interdisciplinary journal of ring-tree science. This article sheds light on the dependency of riparian cottonwood trees on sources of groundwater and their sensitivity to climate change. I would classify this article as an academic peer-reviwed article as it was written by experts in the field, with affiliations with the University of Lethbridge. On the title page, it is mentioned that the article was sent for review on August 14th 2018, before being accepted on August 19 2018, meaning that it wen through a revision process before being published. This article also posses a Methods section, Discussion section, and a bibliography deeming it fit to be used for research purposes. I gained a better understanding of how cottonwood trees absorb nutrients and the level of sensitivity they have towards the environment.


Philipsen L.J., Pearce D.W., Rood, S.B., (2018). Hydroclimatic drivers of the growth of riparian cottonwood at the prairie margin: River flows, river regulation, and the Pacific Decadal Oscillation, 51:82-91.

Blogpost 7: Theoretical Perspectives

User:  | Open Learning Faculty Member: 


The major underpinnings of my project seem to fall on Spotted Knapweed’s (Centaurea maculosa) germination cycle and preferences. While plants produce thousands of seeds which can be relatively to disperse, frequency of plants seems to be correlated with environmental gradients. While my project is examining the potential connection between cover type (controlling amount of access to sunlight) many literature articles highlight Knapweed’s specific preferences for soil type, soil drainage, and ease of colonization (i.e. a recently disturbed area versus an undisturbed area). These potential confounding effects will be further discussed in depth in the final report. The distribution as examined by frequency of Spotted Knapweed is relevant to conservation of native species and invasive species control, especially with this aggressive competitor.


Three key words which could be descriptive of the project could be: sunlight access, Spotted Knapweed frequency, and/or invasive species distribution.


Blog Post 1: Observations

User:  | Open Learning Faculty Member: 


I chose to observe the cottonwood trees in the backyard of my childhood home. Our yard is 100×30′, located in the suburbs of South Surrey British Columbia. There are two cottonwood trees among the fauna in our backyard that I chose to observe. There are also two Douglas fir trees, that surround the largest cottonwood and smaller shrub plants that line the floor of the tree dominated area.  The tallest cottonwood is approximately 80′ high, and has recently began to sprout a younger tree 5m from its trunk. Both cottonwood trees have been spreading their roots throughout the yard, with many of the roots emerging from the soil. We first witnessed the roots emerging about three years ago, and now they have taken spread throughout the majority of the yard.

I began my observations on June 1st, 2019 at 3:00pm. The temperature was 22 degrees celsius, with very few clouds interrupting the sun. I have split the yard in two 50’x10′ sections as the cottonwood trees are conveniently located on opposite ends of the yard.

The three questions that came to mind during my observations were:

  • Are the surrounding plants of each cottonwood tree affecting access to nutrients?
  • Is the younger trees growth success due to its nearness to what was an old vegetable garden?
  • Which cottonwood tree supports the most wildlife?

Blog Post 6 – Data Collection

User:  | Open Learning Faculty Member: 


In total I sampled 75 replicates (25 replicates from each sampling region). I created one 60 inches by 60 inches plot in each sampling region and then proceeded to divide that plot into 25 12 inches by 12 inches quadrants. The only problem I encountered in implementing my sampling design was the same as listed in blog post 5. My sampling design was quite time consuming, but I chose to continue with my design because it was the most accurate. In my hypothesis I predicted that the less shade (and therefore more sunlight) the clovers have access to the higher the abundance/frequency would be. The patterns that I noticed did support my hypothesis. When revisiting my study location, I did notice that the grass had been cut and that the grass was cut much shorter in the larger open areas of grass than the grass around the trees (likely because of the difficulty of maneuvering a lawn mower around the trees). This did make me consider that the clovers in sampling region “shade” and “partial-shade” may experience more competition than the clovers in “no-shade” because of the longer grass. I am considering that this may be a contributing factor to the lower abundance in those areas. However because my data collection was only 7 days apart and the data was very similar I do not think it had too much of an effect.