Blog Post #3: Ongoing field observations

The organism that I plan to study is Vincetoxicum nigrum or Dog Strangling Vine. More specifically, the seed production of the vine.

Along the north/south length of my study area, I can find the vine growing in the densely vegetated area between the creek and the pathway on the west side of the study area as well as along the hill side, on the east side of the study area. I do not see it growing in any substantial way in the manicured grass area between the slope and the pathway, however it is possible that the vine is trying to grow there but is impacted by the grass cutting.

I have noticed that the vines in the densely vegetated area appear to be healthier and more productive than the vines growing along the slope. In the vegetation the leaves are stiff and the vines are tall, wrapping around many other plants and spreading out. On the slope, the leaves are wilted and soft. The vines do not grow as tall on the slope either. Event where a tree or bush provides a possible climbing aid.

A few things may be causing this difference in plant health. Perhaps the amount of sunlight on the slope is too high. Or maybe there is more nutrient available in the wooded area. During site observations, I noticed that the soil on the slope is very hard and dry whereas the soil in the wooded area is noticeably wetter. This is consistent along the north/south length of the study area. It is a common sight in the surrounding area to see large patches of Dog Strangling Vine growing in full sun, on slopes. The difference is probably not too much sunlight. I suspect that reduced water availability would impact the plants ability to perform transpiration, which as a result, would impact the level of nutrients brought into the plant, with the water, for growth and reproduction.

Considering the above, I hypothesize that differences in water availability are impacting the vines ability to grow and thrive. My prediction is that plants in drier soil will produce fewer seed pods.

Based on my hypothesis and prediction. The predictor variable is soil moisture and the response variable is the number of seed pods per plant. The number of seed pods would be counted on a numerical scale and so would be a continuous variable. Depending on the measurement device, soil moisture could be categorical – in the case where a moisture probe simply displays one of a discrete set of value: dry, moist, wet, etc..) or continuous  – in the case where a moisture probe displays a spectrum of out puts ranging on a scale from dry to wet. In this case, the moisture probe in use displays a spectrum and so would be considered continuous.
notes August 16 notes August 23 Photos August 16-23

Post 3: Ongoing Field Observations

I plan on studying Arctostaphylos uva-ursi (Kinnikinnick).

Hypothesis: Overhead plant life will negatively effect the height of kinnikinnick.

Prediction: Plant height will decrease under layers of vegetation

Response variable: Kinnikinnick

Explanatory variable: Overhead plant life (continuous)

Study is continuous. (Regression approach)

An underlying process that may have caused the observed patterns could be soil type. The open areas had little to no LFH layer and the soil was coarse and very well-drained. The areas of more cover had a little larger of an LFH layer and the soil was less course but still well-drained. This could be the underlying cause of the pigment and growth difference between the two locations.

blog post 3 journal

Blog Post 3: Ongoing Field Observations

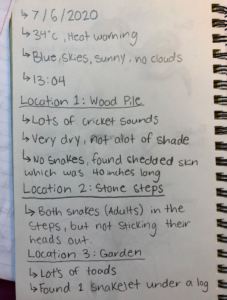
  • July 6th, 2020, 13:04
  • Heat warning in effect, 34* 
  • Sunny, no clouds


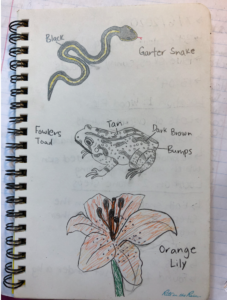
  1. The organisms I’ve chosen to study are the garter snakes (Thamnophis sirtalis).
  2. The three areas I’ve selected area: the wood pile, the stone stairs, and the garden. Today the snakes are staying inside the cracks in the stone steps, this is a good place for them to be today since they’re out of the sun and the temperature is much cooler than the wood pile or garden. This distribution is different from the usual as the snakes are usually found in the wood pile or garden, most likely because there is an abundance of food (insects, small rodents, toads, etc) in these areas. 
  3. I think the reason for the snakes staying inside the stone steps today is due to the heat warning. Snakes are classified into the thermoregulating type ectotherms. Meaning that  they cannot regulate their body temperatures and therefore must rely on external sources of heat. If a snake’s body temperature gets too high (or low) they can die, to ensure that the snakes keep a suitable body temperature they find cooler places such as the cracks in the stone steps. My hypothesis is that when the ambient temperature reaches over 30*c the snakes will spend the day in the stone steps. 
  4. My predictions are that the snakes will not be out in the open during hot days and will be together, to conserve body heat, during thunderstorms and colder days. The response variable is the garter snakes, and the explanatory variable is the ambient temperature.

Blog Post 3: Ongoing Field Observations

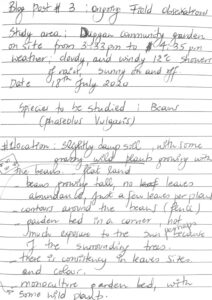
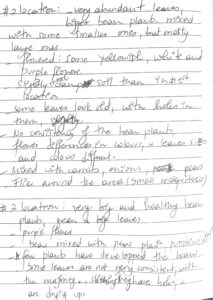
Below are the scanned images from my field journal showing the ongoing Field Observations at Duggan Community Garden. This time I decided to narrow my observations to one plant species-the beans (Phaseolus vulgaris)-in the garden.

Below are the images of the three locations where I did my observations. Location 1, 2, and 3 respectively.
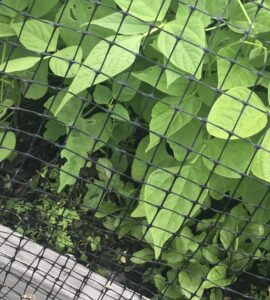
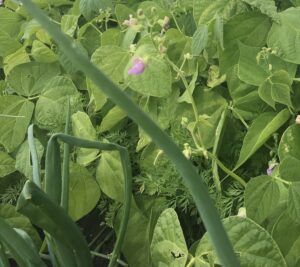
Processes that may have caused the observed patterns. 

  1. More exposure to the sun may have caused more abundance of the bean plants, especially the larger leaves, and the abundance of flowers.
  2. The presence of other plant species, other than the beans may have induced more growth.

Hypothesis

The growth of bean plants is stimulated by the presence of other plant species in a polyculture environment.

Prediction

The beans in the first location (first garden bed-monoculture) will grow less abundantly (fewer leaves; and fewer flowers per plant) than the beans in the second location (Fifth garden bed from the first one-polyculture).

Variables

Predictor variables: presence or absence of other plant species (in this case carrots, pumpkins, peas and onions) in the same location (one feet) from the bean plants.

Response variable: bean plant abundance (total number of leaves, and flowers per plant)

The response variable is continuous, while the predictor variables is categorical (two level factor).


Blog Post 3: Ongoing Field Observations

The biological attribute that I plan to study for my field research project at Erlton/Roxboro Natural Area is soil moisture along a slope. The pattern that led me to this question was the distribution of trees across my gradient. The bottom of the slope was marked by a canopy of large trees, the middle of the slope consisted of frequent, medium-sized trees while the top of the slope was marked by infrequent, notably smaller trees and saplings. I plan to combine these two pieces of information to determine how the angle of the slope impacts soil moisture, and subsequently investigate whether this is a potential limiting factor for tree frequency, and size.

I will conduct my research over the entire area of my slope, but will subdivide it into three horizontal cross sections in order to capture three distinct percent slopes. The first will be just under the top of the ridge on the steepest part of the slope, another will be at the midpoint where it is more moderate and the last one will be at the bottom where the earth is essentially flat (see attached scan below).

Blog Post 3

I hypothesize that slope will impact soil moisture levels and I predict that soil moisture will be negatively correlated with percent slope and positively correlated with tree frequency and size. Furthermore, I predict that there will be a trade-off between tree frequency and size and that as soil moisture reaches it’s maximum, tree frequency will decrease while size increases.


Potential Response Variable: Soil moisture level (instrument specific – could be either)

Potential Explanatory Variable: Percent slope (continuous)


Potential Response Variable: Tree frequency (continuous) and/or size (continuous)

Potential Explanatory Variable: Soil moisture level (instrument specific – could be either)

Blog Post #3

I have decided to study vegetation abundance with increasing distance from the creek.

  • Cows Parsnip (Heracleum umbellifers)
  • Sweet Clover (Melilotus officinalis)
  • tufted vetch (Vicia cracca)
  • White Clover (Trifolium repens)
  • grasses

I choose four spots along the creek to observe the plants growing there and noticed that wherever the Cows Parsnip was growing, no other plants (besides grass) were growing. The other wildflowers grew everywhere on top of the creek bank, but not near the water. The Cows Parsnip seemed to grow closer to the creek and in damper areas. They also grew more in the shade, while the other wildflowers appeared to grow where there was more sun.


  1. Near Greenhouse.

The wildflowers only grew on the banks of the creeks. The banks here are very steep and the only organism growing near the water is grass. Wildflowers are covering the field next to the walking trail.

2. Near Library.

I stopped seeing the other wildflowers when the Cows Parsnip begins to show up. There is a group of approximately 20 of them in this area. They are in the tall, damp grass and under the shade of the tress. The banks are more shallow here so the other wildflowers are growing closer to the creek.

3. Kin Park Bridge.

The Cows Parsnip are flourishing on the shallow decline to the creek. They are about 2-3 meters from the water.  The closer they get to the creek, the larger and more green they are. The other wildflowers stop near the top of the bank.

4. Across from baseball diamond.

There are tons of Cows Parsnip growing here. There are no other wildflowers here. The Parsnip appears to be greener and have whiter flowers closer to the creek.

It seems as if Cows Parnsip is better suited to survive harsher condition than the other wildflowers. They continue to thrive without sunshine and in very damp areas.

Hypothesis:

My hypothesis is that proximity to the creek will effect the variety of plant life growing in the area.

Prediction:

I predict that the Cows Parsnip will survive closer to the creek due to it being more resiliant to harsh conditions, whereas the vegetation that need more specific conditions (sunlight and water) to survive will not. I predict that the as distance from the creek increases, the variety of plantlife will also increase.

A possible response variable is the presence/absence of the types of vegetation (categorical) and a possible explanatory variable is their distance from the creek/shade of trees (continuous).


Scan of field journal:

Scan (dragged) 2

Scan (dragged)

Blog 3: Ongoing Field Observations Lost Lake

PROCESS 

Each visit I had to my chosen site left me wondering what attribute to study. At a certain point, I thought that identifying mosses and their location based on limiting physical factors of water availability would be a great way to increase my abilities to identify mosses. However, I couldn’t define a pattern – just that moss grows everywhere around Lost Lake, including underwater. I also want to make sure that I stay on the trail system as much as possible to avoid damaging undergrowth or acting contrary to park rules. I am in a populated area and my actions may be copied by a park user unknowingly.  

The next organism that I noticed, are conks! I am only seeing the conks growing in one stand of trees on the west side of the lake in a square area of about 25 m2. This is now the organism I have decided to study as I noted its presence heavily on the west side of Lost Lake but nowhere else around the Lake.  

HYPOTHESIS 

The distribution of conks growing on trees at Lost Lake is limited to tree species and is determined by tree health.  

PREDICTIONS 

I predict I will find conks growing on only one tree species in all sections of the tree (lower third, mid-third and top-third) and that I will find conks on trees that have obvious signs of health decline (diminishing canopy, excavation by wildlife, browning needles, severe lean). 

POTENTIAL RESPONSE AND EXPLANATORY VARIABLES 

My predictor variable is tree species (type). My response variables are the conks (presence or absence) and tree health (good or declining). Both the predictor and response variables are categorical as they are classified into one or more unique categories. 


Blog Post 3: Ongoing Field Observations

Blog Post 3: Ongoing Field Observations
I have decided to do a presence/absence study of frogs, in 5 locations in a 251.54 km² area of Prince Edward Island.
Prince Edward Island has been farmed for over 200 years, removing over 90% of its natural Acadian forest throughout the 20th century. Since the 1990s, there has been more of an emphasis on restoring native, Acadian species to the land, increasing buffer zones to protect waterways, and increased monitoring of the native species on the island. Many areas have undergone restoration to increase native species and restore fish passages that had been previously cut off from poor management practice like hanging culverts and filling in ponds. The field of study are five locations within the south shore of Prince Edward Island. All these areas are under some kind of management, and some have had considerable restoration work. Others have been left alone; however, they are all near active farming sites, as farming makes up a third of the industry on Prince Edward Island, covering 42% of the island. Based on location to farming sites, I expect to see/hear more frogs the farther they are from active farming sites. Heavy nitrogen and phosphorous levels may impact the number of breeding individuals at a site. I fully expect to see/hear frogs throughout the breeding season, however, I predict they will be more abundant in sites with less effluent from farming. I plan on returning after sunset for 5 locations every two weeks to collect audio and other data from the sites.

assignment 1-data set
Response Variable: Presence of frogs
Explanatory Variable: Categorical next to farms; Continuous-time and date of study
Reference:
https://www.princeedwardisland.ca/en/information/agriculture-and-land/agriculture-on-pei

Blog Post 3: Ongoing Field Observations

The biological attribute that I want to study is soil, specifically soil texture along a slope gradient.

During my site visit to the grassland area I noticed that the site was distinctively broken into two zones: a steep slope section and a gentle slope section. The steep slopes are ≥ 25% while the gentler slopes are ≤ 18%. I decided to capture this transitional gradient by selecting 2 plots on the gentle slopes and two plots on the steep slopes to observe the soil textures in these two different slopes.

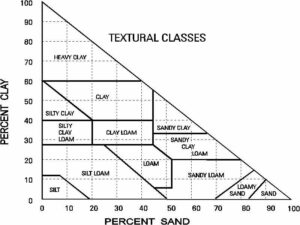
In texturing the four soil samples along the gradient I found that the two plots on the lower slope were both Silty Loam textures while the steep slope plots were both Sandy Loam textures. The higher percentage of sand in soil, the courser the soil.

Initial Hypothesis and Prediction: My hypothesis is that Slope % impacts soil texture results. My prediction is that the steeper the slope percent, the courser the soil texture results will be. Specifically, I predict that slopes ≥ 25% will have higher percent sand compared to slopes ≤ 18%.

Note: Vegetation type and vegetation cover can also impact soil texture, therefore I will be collecting data on both of these variables at each plot in subsequent data gathering.

Blog Post 3


Response Variable: Soil texture (Continuous)

Explanatory Variable: Slope % (Continuous), Vegetation type (Categorical), Vegetation Cover (Continuous).


References: Soil Triangle – https://governmentofbc.maps.arcgis.com/apps/MapJournal/index.html?appid=bfebc043b5a546deb9d381e36742407d


Blog Post 3 – Ongoing Field Observations

As of February, 2020


For my field research project, I have decided to study plants from the phylum Bryophyta


While visiting Mount Tolmie, I definitely noticed the amount of rocky faces as well as the incline, which is steep at times. While hiking this incline, I noticed that the types of plants seemed to change with elevation, forming a transitional zone. I noticed especially that there was a great variety in the types of moss present in the area, and seemed to change with respect to the elevation on the mountain. With the help of iNaturalist.org, I identified the following species from the phylum bryophyta that I observed on Mt. Tolmie. 


  1. Broom Moss  (Dicranum scoparium)
  2. Wooly Fringe-moss (Racomitrium lanuginosum)
  3. Cat’s Tail Moss (Isothecium stoloniferum)
  4. Hedwigia ciliata 
  5. Orthotrichum lyellii 


I hypothesize that on Mt. Tolmie, the density and diversity of bryophytes will be affected by an increase in elevation. I predict that the density and diversity of bryophytes on Mt. Tolmie will decrease as the elevation increases, moving along the gradient. I think that this change in elevation will cause more exposure to the elements, in a more hostile environment I think there will be a decrease in temperature, increased wind speed/exposure, decreased humidity and decreased soil nutrients associated with this increase in elevation. So, I predict that there will be a decrease in the number of moss plants seen and the diversity of the moss plants as I ascend the mountain. I predict that there will be an abundance of mosses near the base of the mountain, and the top will have very sparse populations. This hypothesis will be evaluated by the effect of the elevation (predictor value) on the abundance of mosses in each quadrat I study (response variable). I plan to gather several sets of data on these two variables along the gradient, which I expect to present a trend in abundance with elevation. Because the response and predictor variables are both continuous, I will use a regression study for my experiment.