Blog Post 6: Data Collection.

I collected data for 15 days continuously, it was supporting my hypothesis. I sampled 11 replicates, 5 m around the ponds and along them and the same distance for my spots along the river as well. I counted the number of geese in that space. I also recorded the weather while collecting the data. This was the only way that I could do replication to support my hypothesis. I have noticed positive ancillary patterns that support my hypothesis.

At first I thought my sampling design was Tabular but then after considering my data I decided that it was logistic regression because my response variable is continuous.


Blog Post 6- Data Collection

      I have begun implementing my experimental design by collecting field data from my study site. As previously mentioned in an earlier assignment, I will be performing 30 replicates total (10 replicates per study site). In order to be finished by module 8 I have chosen to do 10 replicates (1 study site) per module. This week I did my first set of 10 replicates and it went very smoothly. I chose my first location- the elderflower shrub branch. This is the location that is furthest from the road and my prediction is that this location will have the most Western Honeybee pollination activity. I counted the number of honeybees that pollinated the branch over 5 minutes, then repeated this 9 more times. My numerical data was written in my field journal in addition to the time that this data was collected and other pertinent information. As I have only collected data from one treatment site, I cannot comment on whether or not this data is congruent with my prediction because I have no other data to observe it against.

       So far I have not had any difficulties implementing my sampling designs. But I may run into problems in the following weeks. The weather is getting colder and the plants in this community garden are beginning to wilt and become dormant. I am nervous that my other treatments will not be viable by the time I get to observing them. I initially planned on completing this before the cold weather came but due to unforeseen circumstances (involving a glass of water and my laptop!) I was not able to access my modules/experiment information and schedule this experiment as I had initially intended. However, I will remain hopeful for the next 2 weeks and ideally be able to obtain accurate data for this study. Perhaps I will have to choose different plants that are still active in the same location of the treatment sites left. This is unfortunate because I initially had chosen my sample placements because of their similar characteristics. I am hoping that there will be some similar samples left in the locations I am studying during the weather changes.

Design Reflection

My sampling strategies went better than I expected during the first few times I went out monitor ant activity. There was obvious ant activity that made the data collection easy. However, I am currently having some difficulties with my method. We have had some bad weather recently that has made any animal or insect activity scarce. Once the weather clears up, I plan to continue my current method of collection. The only modification may make is checking more frequently. I was going out every few days so as to not be too disruptive and cause a fluctuation in the numbers due to human activity. However, the weather this time of year can vary so greatly at any given moment that taking multiple samples a day (before bad weather and after, morning and afternoon etc) may help me acquire better results.  I also need to make sure I wait for it to be warm enough for ants to be out when I go out because some mornings can be cold and have not much activity.

One thing I found surprising is the number of ants changed the day before the weather changed. I went out to collect data and found no ant activity in any of my quadrats. Given the amount I had found previously I was not sure why there was none on the day I went out, especially in areas where the numbers have been consistent.

Blog Post 4- Sampling Strategies

Below are the results from the sampling strategies:

Sampling Method
Species Systemic Random Haphazard
Eastern Hemlock Estimated- 376.0 Estimated-429.2 Estimated- 532.0
Actual-469.9  Percentage Error-20% Percentage Error-8.5% Percentage error- 13.2%
Sweet Birch Estimated-136.0 estimated-116.7 Estimated-136.0
Actual-117.5 Perctage Error-15.7% Percentage error- .68% Percentage error- 15.7%
Yellow Birch Estimated-100.0 Estimated-120.8 Estimated- 92.0
Actual-108.9 Percentage error-8.17% Percentage error-10.9 Percentage error-15.5%
Chestnut Oak Estimated-88 Estimated-79.2 Estimated-88
Actual-87.5 Percentage Error-.57% Percentage Eroor-9.5% Percentage error-.57%
Red Maple Estimated-80 Estimated-100 Estimated-84
Actual-118.9 Percentage Error-32.7% Percentage Eroor-15.9% Percentage error-29.4%
Stripped Maple Estimated-0 Estimated-45.8 Estimated-20
Actual-17.5 Percentage Error-100% Percentage error- 161.7% Percentage error-14.3%
White Pine Estimated-0. Estimated-4.2 Estimated-8.0
Actual 8.4 Percentage Error-100% Percentage Error- 50% Percentage Error-4.8

The most accurate sampling technique for the most common species, the Eastern Hemlock, was the random sampling. The error percentage is roughly half that of the other techniques used. For the rarest species, the white pine, haphazard was the most accurate. The most efficient sampling technique in terms of time was systemic which took 12 hours and 34 minutes to complete. The others were not far behind that with random taking 12 hours and 48 minutes and haphazard taking 13 hours and 8 minutes to complete. My data showed that the abundance of trees, in general, impacted the accuracy of all methods. The less dense the trees, the more likely it is to have variations in the data. Twenty four points of sampling is not enough for this location. The trees spread out in a such a way that the results can be misleading. One area may have way more of one type of tree then other locations. To get a more accurate reading more sampling is needed and spread out in a way that all types of trees can be accounted for.

Blog Post 5: Design Reflections.

My initial data collection based on my strategy went well. Since day 1 the density of geese around the waterbodies was obvious and the areas that I chose to collect data from were fairly close to each other. As I was collecting data I noticed that the number of geese around the ponds were much higher than around the river, which was supporting my initial hypothesis. The difficulty in my sampling strategy was regarding replication, I was not sure how to do that. So, I decided to count the number of geese at the 6 locations I chose twice a day and to also record the weather to see if that affected the number of geese. I counted counted the geese 5m around the ponds and river spots because they were in groups.

I was surprised with the data because there were so many geese around the ponds which I did not expect. I collected data using this strategy for 15 days. I also thought about dividing the grassland around just one pond into 10 quadrats and count the number of geese in them but I was not sure if that would prove my hypothesis, since I wanted to compare the density around 2 kinds of waterbodies. I achieved replication by collecting data twice a day in 6 spots so I did not modify the strategy. I decided to go ahead with my initial strategy because I wanted variation and more data to prove my hypothesis.

Blog Post Three, continuing Observations

The organism I chose to study are ants. 

Throughout the course I watched where ants were in my yard including in my garden, the part of the yard closest to the house, and the part of the yard that is behind a row of trees that was covered in weeds.

I noticed at first there were a lot of ants in the garden by some of the plants I had planted. There was also an abundance of ants in the yard by the house, despite a pool, a trampoline, and children often playing out there. As time went on, I noticed a shift in where the ants were. There are now less in the garden area and in the yard by the house. However, I noticed that there are now ants in the very back patch where there was none before.

A hypothesis I have about the change in ant location is that the effects of the round-up weed killer has decreased due to lack of use making the back half more hospitable.

One potential response variable is the abundance of ants in certain areas in the backyard (garden, main yard by the house, and the back part). A potential explanatory variable is that effects of the weed killer is wearing off. This would categorical as it will be measured by the absence and/or presence of ants.

Blog Post 4- Sample Strategies.

The results of the three sampling strategies used in the virtual forest tutorial.


Based on the time spent sampling, the Distance Random sampling was the most efficient with 4 hours and 43 minutes, Area Systematic sampling took 12 hours and 37 minutes and Haphazard sampling took 12 hours and 48 minutes. For the common species, the most accurate sampling strategy was the Systematic sampling. The most accurate for rare species was the Random sampling strategy. The accuracy declined for the rare species for the haphazard sampling strategy. 24 was not a sufficient number of sample points to capture the number of species in this community.  No it was not enough sample points to accurately estimate the abundance of these species. The accuracy for the haphazard sampling strategy changed for the common species and rare species. The systematic sampling strategy was more accurate compared to the 2 other strategies.

Blog Post 3: Ongoing Field Observations.

Based on my observations from the field, the organism that I plan to study is the geese (Branta canadensis) here in Winnipeg. They are abundant during the summer-fall time. Oct 1st, 2:24pm, the weather was 7°C, sunny and a bit cloudy with a wind chill.

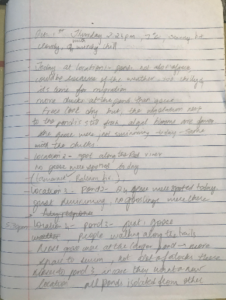
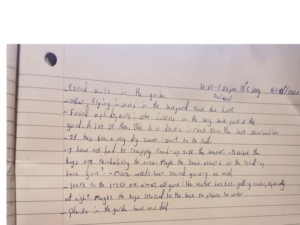
Fig 1: Page from journal on Oct 1st.

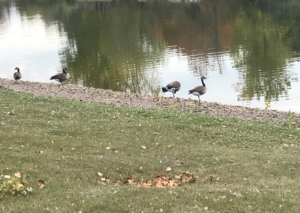
Fig 2: Geese from pond 1.

The geese are usually in large groups and are secluded from other species, they are always around water bodies, usually ponds and rivers. I chose to do my study about the geese because from day 1 they were around the area and showed a distribution. The geese are with their young, they feed on the vegetation around the ponds. The locations that I chose to study about the geese distribution are 3 ponds in the area and 3 spots along the Red river. Pond 1- had around 40 geese, most of the geese were around the pond foraging and swimming. Pond 2- had about 24 geese on it, they exhibited the same activities, foraging and just stay around the pond. Pond 3-  on this day there were 4 geese. The three spots on the river combined had only 2 geese. This pattern of the geese distribution was similar from day 1.

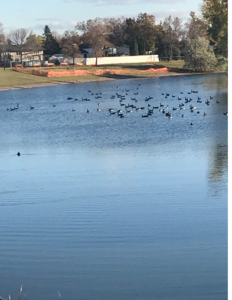
Fig 3: Geese from pond 2.

So I based my hypothesis on the distribution of geese around these 2 types of water bodies. There was an abundance of geese around the ponds as compared to next to the river. The underlying processes that may cause this pattern,

-could be that the geese prefer the vegetation (common Ragworts and common Plantains) next to the pond as compared to the river.

-It is a safer area with no other species around.

– There is no other activity on the water, like boats, etc.

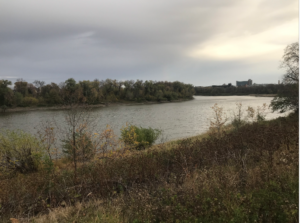
Fig 4: counting spot ta the Red river.

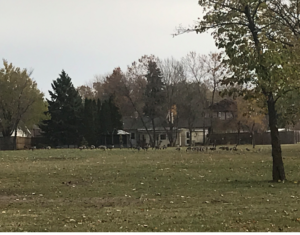
Fig 5: Geese from pond 3.

My formal prediction is that the grassland with lesser species around will support more geese living there (no competition for resources).  Based on my hypothesis, the explanatory variables are the location of the water bodies and the grassland around the pond and river. And my response variable is the number of geese present at the areas at a particular time of day.  I will collect data by counting the number of geese at these locations for 11 or more days at 5:30pm . And will hopefully determine that the geese prefer to stay in smaller, stagnant waterbodies were not a lot of other species are around. Based on my explanatory and response variables, they are categorical and I will use the tabular design by doing a constant time sampling to prove my hypothesis.

Post 9: Field Research Reflections

The beginning of this field research assignment definitely had its challenges for me. I did my research in a location I was not at all familiar with so it lead for several questions to figure out on top of figuring out what I wanted to research. In my original design implementation I was not sure how to collect effective data for my study. This lead to poor data that would not be a good contribution to my research. Once it was decided to take several measurements of individual branches of the randomly selected plants I was given a better overall understanding of my data. It painted a clearer picture of the plant I was studying. My research of this species also helped give me a good understanding of the functions of a plant that is commonly found. This definitely gave me a greater understanding and appreciation for how ecological theory is developed. In this case though, I would like to leave the research and studies to the professionals in the future and educate myself through their findings.