Recent Posts

Blog Post 4: Sampling Strategies

User:  | Open Learning Faculty Member: 


For the virtual forest tutorial, I used the area sampling technique.  The random sampling strategy had by far the fastest estimated sampling time at 4hours 51minutes compared to the systematic strategy (12 hours 37 minutes) and the haphazard sampling times (13 hours 2 minutes).

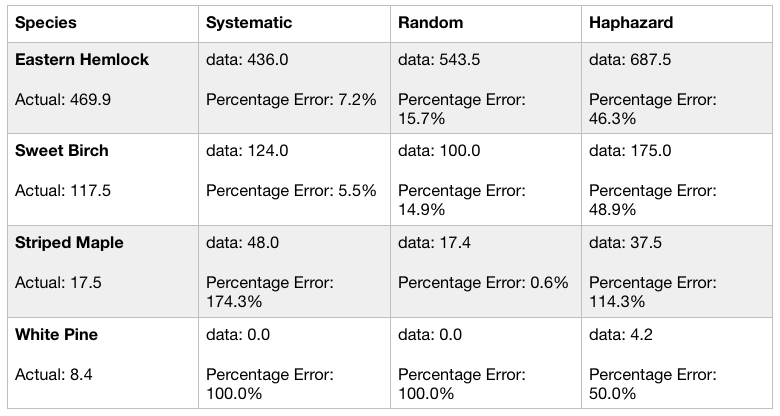
For the two most common tree species, the eastern hemlock and sweet birch, the percentage error was low for the systematic strategy (7% and 5%) and was highest for the random strategy (19% and 36%) (Figure 1).  The percent error from the haphazard strategy varied with the eastern hemlock having the lowest percent error at 6% and a high percent error of 21% for the sweet birch (Figure 1).  Based on the percent errors for the most common species, the systematic strategy seems to be the most accurate, the random being the least accurate and the haphazard being unpredictable with one of the percent errors being low and the other being high.

When looking at the percent error for the two most rare species, the striped maple and the white pine, all the sampling strategies had large percent errors for at least one of the species; this shows that accuracy increases with species abundance and decreases with species rarity.  The systematic strategy had large percent errors (178% and 100%) as well as the random strategy (185% and 48%) (Figure 1).  The haphazard strategy had a comparatively lower percent error for the striped maple at 14% but the white pine had a large percent error at 138% (Figure 1).  All the strategies for rare species were not able to accurately represent the population and the haphazard strategy having a high and low value again shows it is an unpredictable sampling strategy.

I think the systematic strategy was the most accurate when looking at the percent errors for all the tree species.  Surprisingly the haphazard strategy had lower percent errors overall than the random strategy which had the largest overall percent errors.

Blog Post 3: Ongoing Field Observations

User:  | Open Learning Faculty Member: 


The organism I plan to study for the field research project is three types of large forest trees, the western red cedar, the ponderosa pine, and the Douglas-fir tree, within the Woodhaven Nature Conservancy Regional Park.

The trees change along an environmental gradient.  The first location (Figure 1) has many western red cedar trees and is dense with trees (Figures 2 and 3).  The location is shady with lots of dead fallen trees.  The ground cover are plants with dark green leaves; this seems to occur where there is sun exposure.  Much of the ground does not have plant growth due to the shade.  The distribution seems somewhat even.

The second location (Figure 4) is up a steep incline where the main tree is ponderosa pine (Figures 5, 6, and 7).  The soil appears sandy and the ground cover is more grass-like.  These trees are sparse and less dense than locations 1 and 3.  The distribution appears more uneven than locations 1 and 3.

The third location (Figure 8) is densely populated with Douglas-firs but is less dense than location 1 with the western red cedars (Figures 9 and 10).  The ground cover is a mix between grasses and the shrubs with dark green leaves.   The distribution appears even.

An underlying process which may cause the changing of the dominant tree type pattern could be changes in elevation which could influence soil moisture. My hypothesis is elevation influences the types of large trees that grow within a forested area.  My prediction is the first location with the western red cedars has the lowest elevation, the second location with the ponderosa pines has the highest elevation, and the third location with the Douglas-firs has an elevation in between the first and second locations.

The response variable would be the tree type (western red cedar, ponderosa pine, or Douglas-fir) that is growing within an area of the environmental gradient and the explanatory variable is elevation.  The tree type is categorical as the three trees I’m interested in are western red cedars, ponderosa pines, and Douglas-firs and if they are present or absent at different elevations.  Elevation would be continuous as it is measured on a continuous numerical scale.

Blog Post 8: Tables and Graphs

User:  | Open Learning Faculty Member: 


Overall, I am happy with the outcome of the Figure I created. I initially knew quite quickly what information I wanted to convey, namely soil texture results in relation to slope, however, I struggled with the actual representation of this information. The biggest challenge was deciding how to organize my data in a way that would be discernible to any given audience.

Another challenge, though less so then the data organizing, was the formatting of the caption. Finding the balance of giving enough information without describing things unnecessarily is a practiced skill that I am a rookie at.

Hopefully with time and practice this becomes easier!


Post 4: Sampling Strategies

User:  | Open Learning Faculty Member: 


Using the area-based sampling, these are my results from the visual forest tutorial:

Based on my results, all three sampling techniques took about the same time, but the random sampling was slightly faster at 12 hours and 15 minutes.The two most common species were the Eastern Hemlock and the Sweet Birch. Systematic sampling yielded the lowest percentage error for these species. The two least common species were the Striped Maple and the White Pine. As you can see, the percentage errors were extremely high for the Striped Maple using the systematic and haphazard sampling techniques and very low using random sampling. For the White Pine, all the sampling techniques yielded high percentage errors but haphazard sampling was the lowest at 50%. The accuracy seemed to be greater with the more abundant species as the percentage errors were lower compared to the less abundant species. Based off my results, I cannot say that one sampling strategy was more accurate than the others, as the results were varying. I would need a larger sample size in order to obtain more accurate results. 

Post 3: Ongoing Field Observations

User:  | Open Learning Faculty Member: 


I visited the ravine again on November 14th at around 15:30 hrs. It was a cloudy day again with some light rain and a temperature of 7°C. I decided to focus my observations on the ferns this time and also chose the slope as my environmental gradient. From my research, I was able to identify the species of ferns as Polystichum munitum, or the western sword fern. I also took a different route at the top of the ravine to get a different view and to see if I still noticed the pattern of the ferns being more abundant higher up and away from the creek. 

At some points along the trail, there was not a noticeable difference in the abundance along the slope. However, at many areas, I could see that were many more ferns at the top compared to the bottom. I was able to confirm the pattern I saw last time. I stopped at one point along the trail and chose three locations on the slope to study the ferns: at the bottom right by the creek, halfway up the slope, and then near the top of the slope.

Bottom of slope: very moist soil, not many trees, only 3 ferns

Middle of slope: soil a little less moist than bottom, lots of trees, maybe 5-7 ferns

Top of slope: soil a little moist, lots of trees, lots of ferns

There could be many possible reasons to explain this pattern including, soil moisture or water content and sunlight exposure. I know ferns tend to grow in damp, shaded areas, so moisture and sunlight exposure are definitely factors that I can explore as possible reasons for my hypothesis.

Based on my observations I have come up with a hypothesis, prediction, response variable, and explanatory variable.

Hypothesis: Creek proximity affects Polystichum munitum abundance.

Prediction: As distance from the creek increases, Polystichum munitum abundance increases.

Response Variable: Fern abundance (continuous)

Explanatory Variable: Distance from the creek (continuous)

Field journal entry from my visit showing the fern distribution along the slope

Post 2: Sources of Scientific Information

User:  | Open Learning Faculty Member: 


a) I found an article online on fern species diversity in an old-growth forest. I have provided a link to it below.

https://onlinelibrary.wiley.com/doi/abs/10.1111/j.1600-0587.2000.tb00279.x

b) This source of information is academic peer-reviewed research.

c) I was able to determine that it is an academic source because I was able to click on the authors and see that they are affiliated with a university. There were also in-text citations and a bibliography. 

Next, I could see that it was peer-reviewed because there was an acceptance date, as well as the authors thanked some people in the acknowledgements section for “providing helpful comments on earlier versions of this paper.”

 Finally, I concluded that it was a research source due to the presence of a methods and results section, meaning they reported results of a field study. 

Post 1: Observations

User:  | Open Learning Faculty Member: 


The site I have selected for my project is a ravine in the Yorkson Creek Trail of McClughan Park in Langley, B.C., Canada. It is located behind an elementary school and there is a bridge that crosses over the creek. It is quite a popular trail for people to take their dogs on walks. I visited the ravine on Friday November 13, 2020 at about 14:10-14:45 hours. It was a cloudy day with a temperature of 8°C. There was heavy rain in the morning so the ground was quite muddy and slippery. There is a steep slope heading down towards the creek and bridge. It is a heavily forested area with lots of pine trees and also at this time of year, bare trees whose leaves are scattered throughout the forest floor. The creek water was muggy and running quite fast. 

The area is home to many birds, animals, and fish, but I was not able to spot any during my visit. I decided to focus my observations on vegetation. The first plant that stood out to me was at the entrance of the trail, at the top of the ravine. They were some plants with white balls at the ends. I thought it must be some type of fruit in its early stages. Upon further research, I found they were snowberry plants. They were not covered by any trees and interestingly, I only found these plants at the top. This leads me to believe that snowberries need direct sunlight in order to grow. Ferns also caught my eye. They seemed to be scattered randomly throughout the entire area, but after taking a deeper look, I noticed they seemed more abundant around tree trunks and also further away from the creek. The last plant I observed had a thick, thorned stem with large green leaves. It seemed like they grew only near the water, as I did not spot them anywhere else. 

The three questions that came to mind during my visit were:

  1. Do snowberries need direct sunlight or are they able to grow under shade as well?
  2. Do ferns grow primarily under shade? Do they grow in moist environments, but not too close to water? 
  3. Do the large green plants require lots of water to grow?

I would love to study the snowberries, but I think I would like to conduct my research along the elevation gradient of the slope and because the snowberries were only located at the top, they may not be a great topic for my project. Instead, the ferns seem more feasible, so I will focus my observations on the ferns on my next visit. 

Scan of field journal

View of creek and slope from the bridge


Blog Post 2: Sources of Scientific Information

User:  | Open Learning Faculty Member: 


a. The article I chose is Citizen Science in Ecology: A Place for Humans in Nature and the source is from the online TRU Library. The article is from the Annals of the New York Academy of Sciences  The link to the article is below:

https://nyaspubs-onlinelibrary-wiley-com.ezproxy.tru.ca/doi/full/10.1111/nyas.14340

b. Based on the tutorial, I classified the article as an academic peer-reviewed review article.

c. The article is academic due to the authors being experts in their field; I was able to click on each of the authors and see that all of the authors were affiliated with an academic institution, the School of Biological Sciences, University of Utah, Salt Lake City, Utah (Figure 1). The article is also considered academic because it includes in-text citations and has a reference list (Figures 2 and 3).  I was able to determine the article was peer-reviewed by the article having the publication history including the manuscript received date, the manuscript revised date, a version of online record date, and the online issue date (Figure 4).  I was also able to refine my search in the online TRU Library to only search for articles that have been peer-reviewed which also helped to verify the article was peer reviewed (Figure 5).  The article is a review article based on there being no methods or results section; the article also stated at the top that it was a review article (Figure 6).

References:

Adler, F. R., Green, A. M., & Şekercioğlu, Ç. H. (2020). Citizen science in ecology: a place for humans in nature. Annals of the New York Academy of Sciences, 1469(1), 52–64. https://doi-org.ezproxy.tru.ca/10.1111/nyas.14340

Blog Post 1: Observations

User:  | Open Learning Faculty Member: 


The area I have selected to observe is the Woodhaven Nature Conservancy Regional Park.  The park is 29.8 hectares and is located in the Lower Mission area of Kelowna, British Columbia (Parks Services, n.d.).  The park is comprised of woodland areas, riparian areas, and steep slopes.  The park has two small creeks running through it, Bonaparte Creek and North Fork Creek, as well as the larger Bellevue Creek is located on the south perimeter of the park (Figure 1).  The park is designated as a regional park.

An interesting aspect of Woodhaven Park is there are four distinct bio geoclimatic zones which are considered sensitive habitats that are threatened and endangered in the region: a black cottonwood zone, a Douglas-fir zone, a ponderosa pine zone, and a western red cedar zone (Figure 2) (Parks Services, n.d.).  Black cottonwoods grow in damp riparian areas whereas Douglas-firs can grow in a wide variety of soils but prefer partial shade and soils that are well drained (Parks Services, n.d.).  The ponderosa pines are the only pine trees in the area and prefer dry conditions; they are located up the steep sandy hillside (Parks Services, n.d.).  The red cedars are able to block out sunlight resulting in less shrubs where the red cedars are growing (Parks Services, n.d.).

I visited Woodhaven Park on October 24, 2020 at 1:40pm.  It was overcast and there was approximately 15cm of precipitation in the form of wet snow within the previous 48 hours.  There was still snow on the ground and the ambient temperature was -1˚C.

The first aspect I think would be interesting to study is the different bio geoclimatic zones within the park and what is the cause for the different zones?  Upon my initial visit I saw the western red cedar trees and Douglas-firs (Figures 3 and 4), but still need to see the ponderosa pines and black cottonwoods.  My first question is what influences each of the bio geoclimatic zones within Woodhaven Park?

I read the information board at the entrance of Woodhaven Park and it provided information on wildlife trees which look like dead trees that have holes in them (Figure 5).  Although these dead trees can pose a hazard to the public, they are not all removed due to the habitat they provide to the screech owl (Parks Services, n.d.).  The screech owl, which is an endangered species, uses these wildlife trees for nesting and roosting (Parks Services, n.d.).  There are only 200 screech owls left in the Okanagan Valley (Parks Services, n.d.).  The screech owl and the wildlife trees they use as habitat would be an aspect of Woodhaven Park I would like to further study.  My second question is will I be able to see a screech owl during my visits and do other species use wildlife trees in addition to the screech owl?

Upon my visit I also saw three sets of tracks in the snow and wondered what type of animal made those (Figure 6).   They were all headed in the same direction, north.  I also saw two deer without antlers (Figure 7) and a grey/brown squirrel (Figure 8).  My last question is what are the different types of mammals that inhabit Woodhaven Park?

References

Parks Services. (n.d.). Woodhaven Nature Conservancy Regional Park. In Regional District of Central Okanagan. Retrieved from https://www.regionaldistrict.com/media/19817/woodhaven%20brochure.pdf

Blog Post 9: Field Research Reflections.

User:  | Open Learning Faculty Member: 


This was my first field research project that I ever did for a course, it definitely had its challenges in the beginning. It took me some time to decide what I wanted to do my research project on and the location had to be easily accessible to. Once I had decided on what I wanted to do my research project on, data collection was good, even though I had to figure out how I was gonna do my replication. I did have to make changes to my design because my response variable was continuous and I realized that after collecting quite a bit of data. After I changed my design, then my data collection changed a little. But I did collect enough data for my project.

Engaging in the practice of ecology has definitely increased by appreciation for how ecological theory is developed. It is definitely time consuming and needs a lot of dedication and showed me that ecology is a vast field which increased my appreciation for it.