Recent Posts

Post 1: Observations

User:  | Open Learning Faculty Member: 


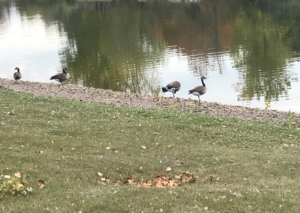
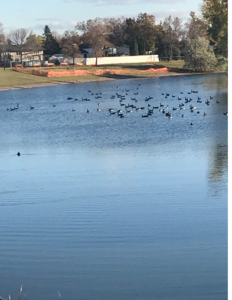
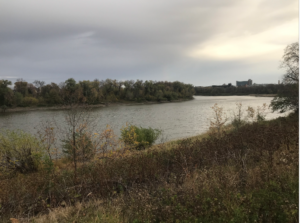
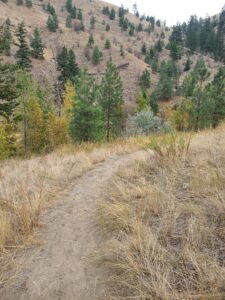
The study site I have selected is a creek formed by lake overflow down a cliff face into a valley surrounded by wetlands. It is called Peterson Creek and is a recreational green space with many groomed walking paths that are frequented by residents and often off leash dogs. Notable wildlife in the area was sparse, with minimal to no tracks visible, near silent trees with only one high pitched chirp coming from a small bird in the brush and a single brown squirrel in a decaying tree stump. The valley has a steep grade slope upwards that dramatically changes the terrain from lush, well-established greenery, to grasslands and eventually desert approximately 50 meters in elevation from the base.

The area I have selected to study is 2 acres total radiating out from the creek bed and up both sides of the valley. The creek bed is mostly a rock base with sediment at the base of the waterfalls but it does not continue down the creek. The edges of the creek are quite steep as spring flooding erodes a deep scar that it left nearly empty by this time of year. Immediately surrounding the creek is grass, bamboo, and medium sized shrubbery with many types of berries visible. Scattered amongst this is a variety of medium and large trees of varying types.

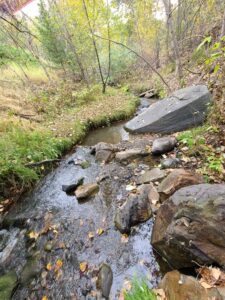
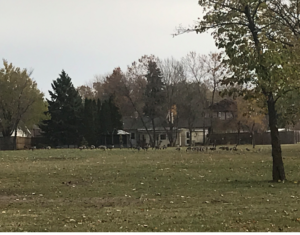
A few I was able to form an educated guess towards their type were Pine, Birch, willow, maple and poplar. The area is located in the city center directly next to the hospital. It is surrounded by busy streets on each side that are not visible from the trails or audible due to the deep valley and brush positioning in relation to the trails. I made my first observation at the site at 13:00hrs, the temperature was 11 degrees C with a gentle breeze. The skies were completely cloud covered. 

I made many interesting observations during my first trip to the site; the most prominent in my mind were as follows. Does the lack of sediment and the narrowness of the creek bed along with the seasonable variability in water levels affect spawning of fish in the area? I also noticed a randomness to tree type and placement and was curious if these were planted intentionally to add appeal to the area and if so, does this adding of biodiversity in the area create more interest for animal population, or does it drive them away due to creating an abnormal habitat for them? Lastly,  I noticed a lack of debris in the creek. There were no sticks or blockages in the water, which struck me as an unexpected finding as a lake is what feeds the creek via a waterfall. Does the potential cleaning out of the creek for aesthetic purposes contribute to the lack of animal inhabitants?

Blog Post 8: Tables and Graphs

User:  | Open Learning Faculty Member: 


I created a table to show the frequency of conk presence and tree species within the three ecotypes I sampled. I sampled 10 replicates in each ecotype resulting in 120 trees sampled. I wanted to see if the data would show a pattern between tree species, tree health and conk presence. I had some difficulty creating a visual representation of the data as I had originally wanted to show a graph, as I feel they are very clear. However, I had many variables I wanted to compare and I was not able to do this in a clean way with a graph. I was able to show conk frequency per ecotype, tree species frequency per ecotype and average tree health per ecotype. The data is showing support of my claim that conks are opportunistic of trees in poor health, however, I think I would need to increase my sample size to show a stronger argument. It is quite difficult to visually represent what you intend when thinking about the data – the process can leave many things lost in translation.

Blog post 6: Data Collection

User:  | Open Learning Faculty Member: 


Data collection for my study has begun. So far I have collected 7 replicates. There were not any problems this time around. The sampling went according to expectations and there were no surprises in the process. Over the process of the data collection, some further observations of the area have been made. I have noticed that there is some grass cutting occurring in the tall grass areas of my study area which I hadn’t noticed before. This could be a contributing factor to the observed differences in the vine growth so I have begun corresponding with the City to confirm the schedule and extent of the grass cutting through the growing season.

Blog Post Three, continuing Observations

User:  | Open Learning Faculty Member: 


The organism I chose to study are ants. 

Throughout the course I watched where ants were in my yard including in my garden, the part of the yard closest to the house, and the part of the yard that is behind a row of trees that was covered in weeds.

I noticed at first there were a lot of ants in the garden by some of the plants I had planted. There was also an abundance of ants in the yard by the house, despite a pool, a trampoline, and children often playing out there. As time went on, I noticed a shift in where the ants were. There are now less in the garden area and in the yard by the house. However, I noticed that there are now ants in the very back patch where there was none before.

A hypothesis I have about the change in ant location is that the effects of the round-up weed killer has decreased due to lack of use making the back half more hospitable.

One potential response variable is the abundance of ants in certain areas in the backyard (garden, main yard by the house, and the back part). A potential explanatory variable is that effects of the weed killer is wearing off. This would categorical as it will be measured by the absence and/or presence of ants.

Blog Post 4- Sample Strategies.

User:  | Open Learning Faculty Member: 


The results of the three sampling strategies used in the virtual forest tutorial.


Based on the time spent sampling, the Distance Random sampling was the most efficient with 4 hours and 43 minutes, Area Systematic sampling took 12 hours and 37 minutes and Haphazard sampling took 12 hours and 48 minutes. For the common species, the most accurate sampling strategy was the Systematic sampling. The most accurate for rare species was the Random sampling strategy. The accuracy declined for the rare species for the haphazard sampling strategy. 24 was not a sufficient number of sample points to capture the number of species in this community.  No it was not enough sample points to accurately estimate the abundance of these species. The accuracy for the haphazard sampling strategy changed for the common species and rare species. The systematic sampling strategy was more accurate compared to the 2 other strategies.

Blog Post 3: Ongoing Field Observations.

User:  | Open Learning Faculty Member: 


Based on my observations from the field, the organism that I plan to study is the geese (Branta canadensis) here in Winnipeg. They are abundant during the summer-fall time. Oct 1st, 2:24pm, the weather was 7°C, sunny and a bit cloudy with a wind chill.

Fig 1: Page from journal on Oct 1st.

Fig 2: Geese from pond 1.

The geese are usually in large groups and are secluded from other species, they are always around water bodies, usually ponds and rivers. I chose to do my study about the geese because from day 1 they were around the area and showed a distribution. The geese are with their young, they feed on the vegetation around the ponds. The locations that I chose to study about the geese distribution are 3 ponds in the area and 3 spots along the Red river. Pond 1- had around 40 geese, most of the geese were around the pond foraging and swimming. Pond 2- had about 24 geese on it, they exhibited the same activities, foraging and just stay around the pond. Pond 3-  on this day there were 4 geese. The three spots on the river combined had only 2 geese. This pattern of the geese distribution was similar from day 1.

Fig 3: Geese from pond 2.

So I based my hypothesis on the distribution of geese around these 2 types of water bodies. There was an abundance of geese around the ponds as compared to next to the river. The underlying processes that may cause this pattern,

-could be that the geese prefer the vegetation (common Ragworts and common Plantains) next to the pond as compared to the river.

-It is a safer area with no other species around.

– There is no other activity on the water, like boats, etc.

Fig 4: counting spot ta the Red river.

Fig 5: Geese from pond 3.

My formal prediction is that the grassland with lesser species around will support more geese living there (no competition for resources).  Based on my hypothesis, the explanatory variables are the location of the water bodies and the grassland around the pond and river. And my response variable is the number of geese present at the areas at a particular time of day.  I will collect data by counting the number of geese at these locations for 11 or more days at 5:30pm . And will hopefully determine that the geese prefer to stay in smaller, stagnant waterbodies were not a lot of other species are around. Based on my explanatory and response variables, they are categorical and I will use the tabular design by doing a constant time sampling to prove my hypothesis.

Blog post 2

User:  | Open Learning Faculty Member: 


Sources of Scientific Information

 Find one source of ecological information. It can be online, from the library, or from a book on your shelf. Based on what you have learned in the “How to evaluate sources of scientific information tutorial”, create a post in which you a) say what the source is (and/or link to it), b) classify it into one of the four types of information discussed in the tutorial, and c) provide documentation to support your classification.

My source is an article available from the Thompson Rivers library, entitled Rising Atmospheric Carbon

Dioxide and Potential Impacts on the Growth and Toxicity of Poison Ivy . This is a peer-reviewed

Academic research paper. It is written by experts in their fields as indicated in the article, making it

academic. It does not say that the article is specifically reviewed in the article, however the Journal

publication guidelines state that the author(s) are responsible to have their paper peer reviewed. Also, it

is indicated as peer reviewed when using filters on the library website. The article contains methods and

discussion of results sections, indicating a research paper.


  1. H. Ziska, R. C. Sicher, K. George, J. E. Mohan, Rising Atmospheric Carbon Dioxide and Potential Impacts

on the Growth and Toxicity of Poison Ivy (Toxicodendron radicans). Weed Science. 55, 288–292

(2007), doi:10.1614/ws-06-190.

Blog Post 1

User:  | Open Learning Faculty Member: 


Blog Post 1: Observations
Your initial post will describe the area that you have selected to observe. Give a brief physical description of the study area. Include its approximate size and location, and a general picture of its topography (i.e., canyon, flat, rolling hills, mountain slope, river bottom, etc.), vegetation (this can be very coarse, for example forested, grassland, wetland, city street with ornamental trees and shrubs, etc.), and designation, if any (i.e., Provincial or City park, golf course, etc.). Also note, when and at what time you visited the site and give an indication of weather and seasonality. Think about potential subjects that you might want to study for your research project. Based on your observations, list three questions that are interesting or striking and could form the subject of your research project. Support the descriptions above with images from your field journal (if you’re using paper and pen, scan your pages; if you’re using digital technology, save your files and submit those).

The area that I selected to observe is an approximately 1km trail that cuts through forested areas, disturbed areas and open field. It is located in the town of Little Current Ontario, on Manitoulin Island. The portion of the trail that I observed is about a minute walk from my house to the trail entrance, so I use it quite frequently. On the day of my last visit, September 21, the day was sunny and warm (18c) with little breeze. The time was approximately 11am.
The trail cuts across public forested land and borders private land. The stretch of trail I was on, is a portion of a large island wide trail system for hiking/ATV/snow mobile trail.
There has been an increase in human traffic this year as workers have been digging up land along the trail. It appears to be related to the hydro poles that cut through the area. Trucks, excavators, and backhoes have been down the trail. This area is generally underutilized, and my family is often the only people on the trail at any given time, with at most one or two other people crossing our path. They are commonly walking their dogs.
Several questions came to mind when observing the area. The poison ivy in the area was of particular interest however, as I am just recovering from over a month of discomfort associated with a large poison ivy rash that I obtained in that area.
Firstly, I had never noticed poison ivy growing along the trail in previous years, other than maybe an odd plant or patch of plants but now the area is covered in copious amounts- why?
Secondly, I wondered why the coverage is almost completely on one side of the trail.
Thirdly, I wondered if the increase this year is related to the workers activities.

field journal sketch